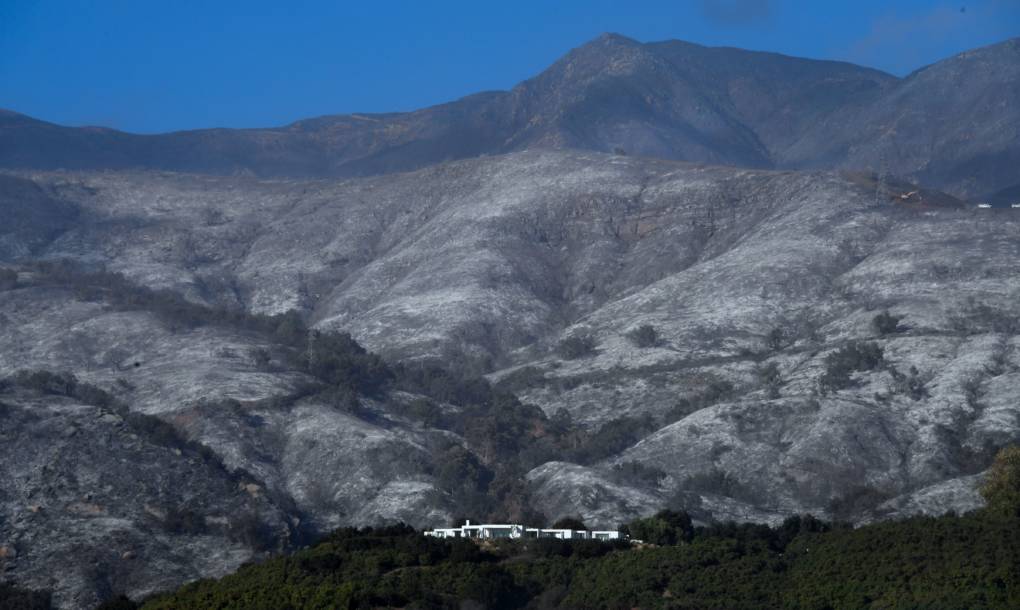
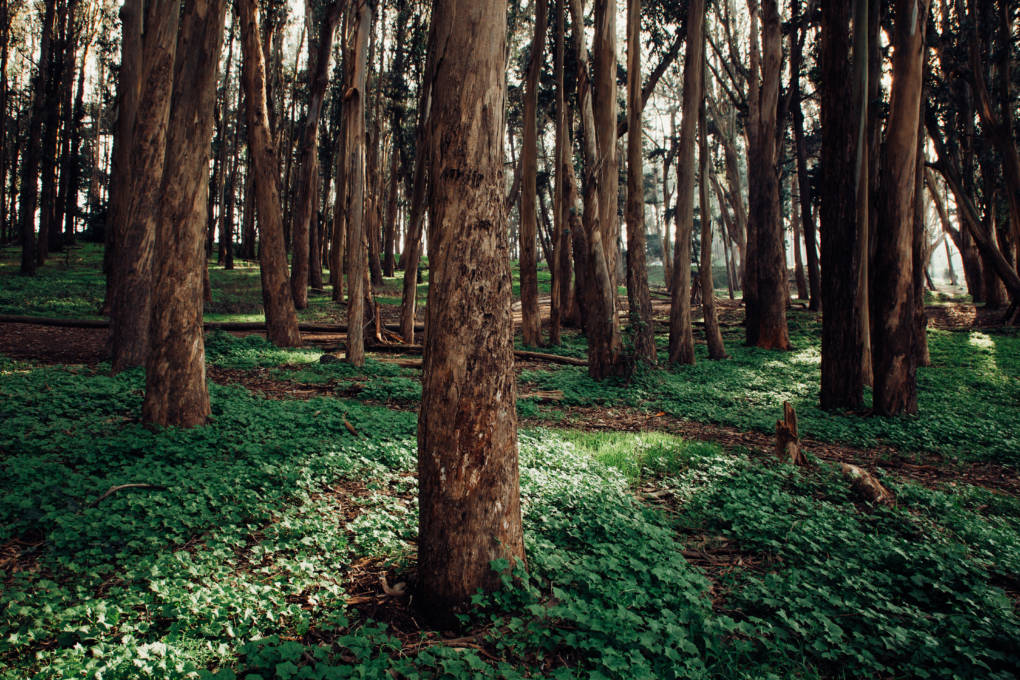
Eucalyptus: How California's Most Hated Tree Took Root
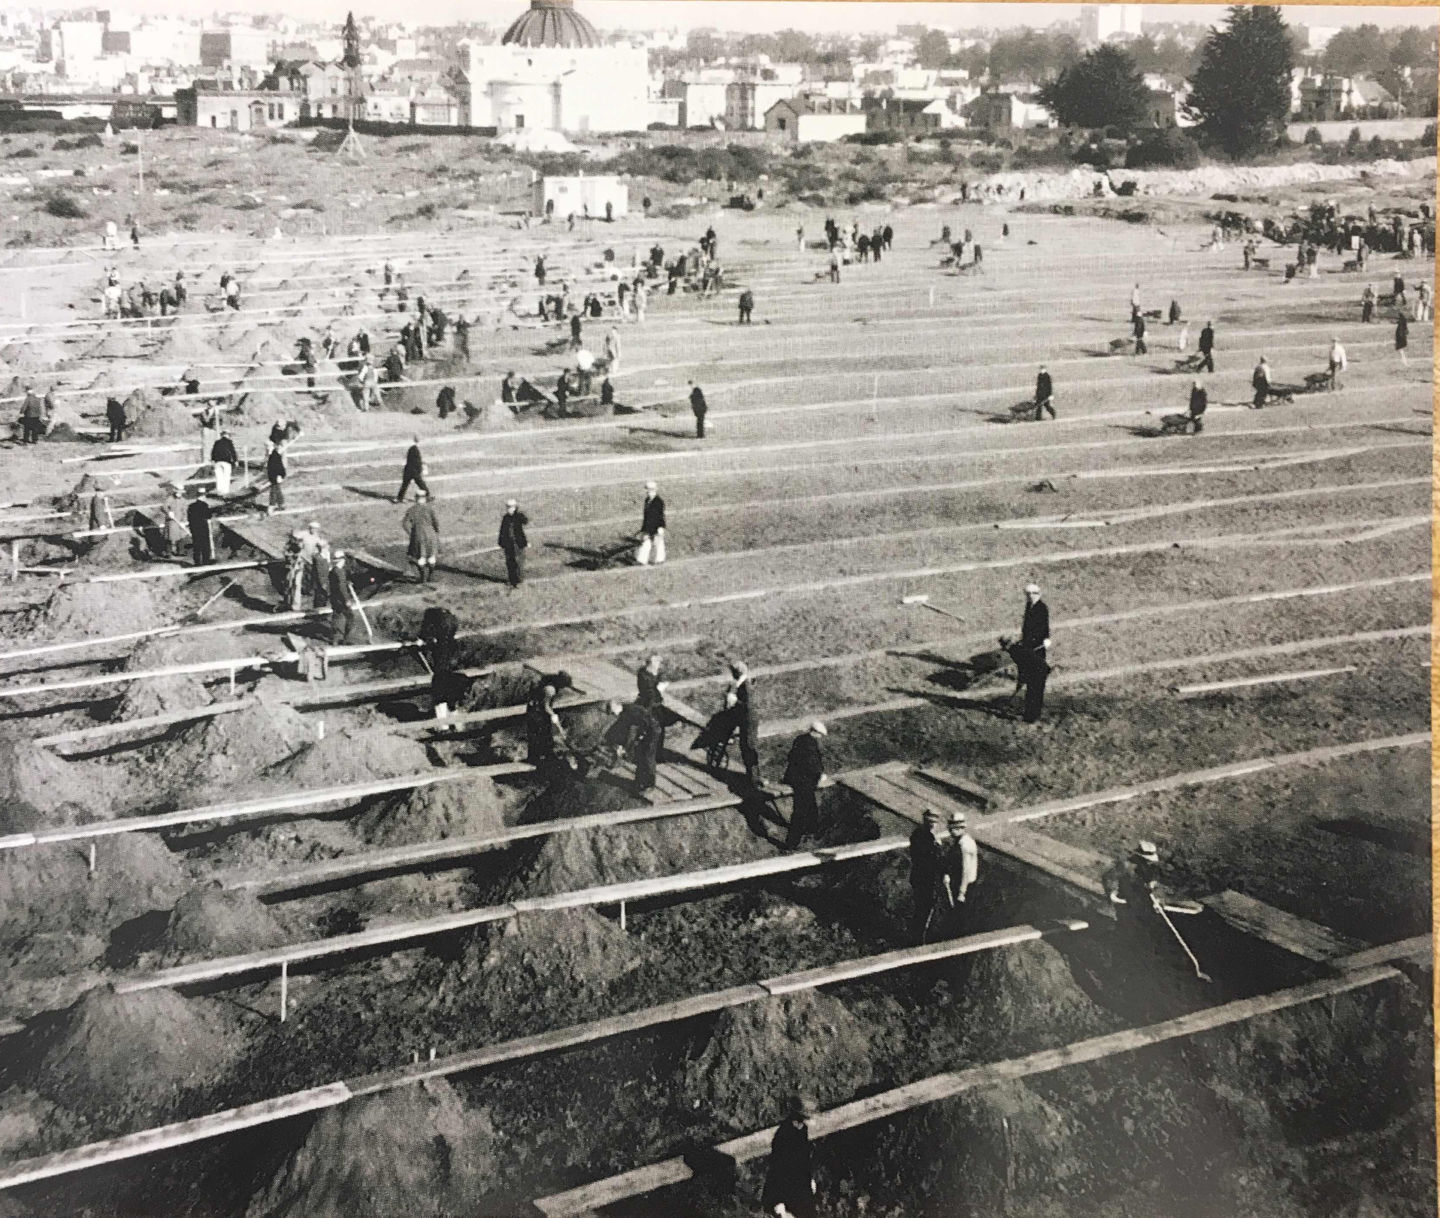
Why Are There So Many Graves in Colma? And So Few in San Francisco?
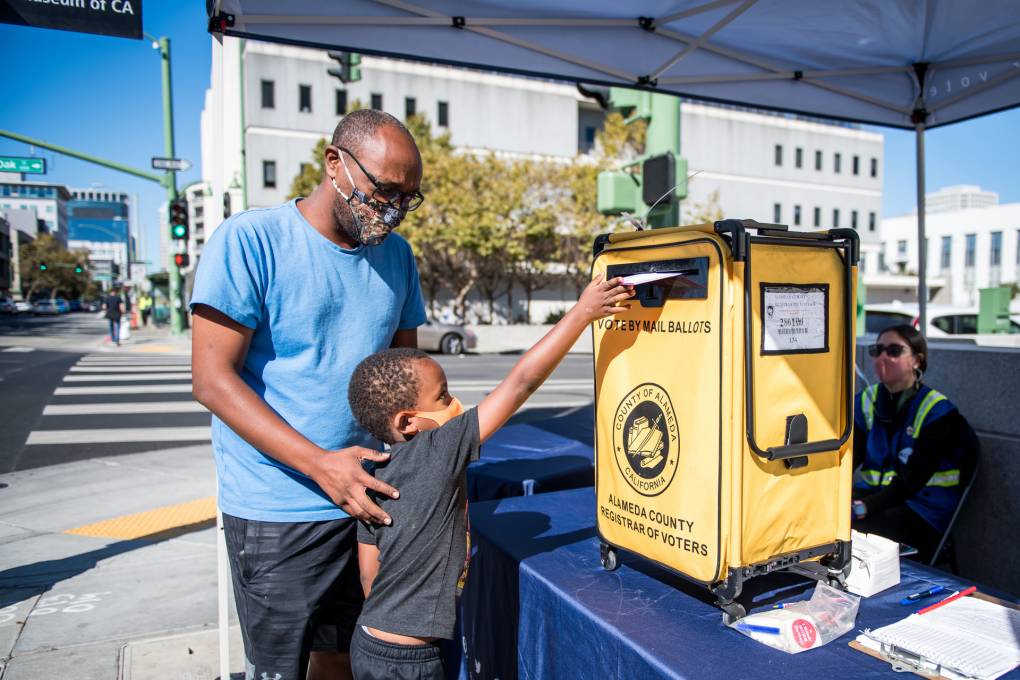
Trump Focused on Restricting Immigration. How Are Bay Area Immigrant Voters Responding?
What Role Would California Play if the Election Outcome Gets Complicated?
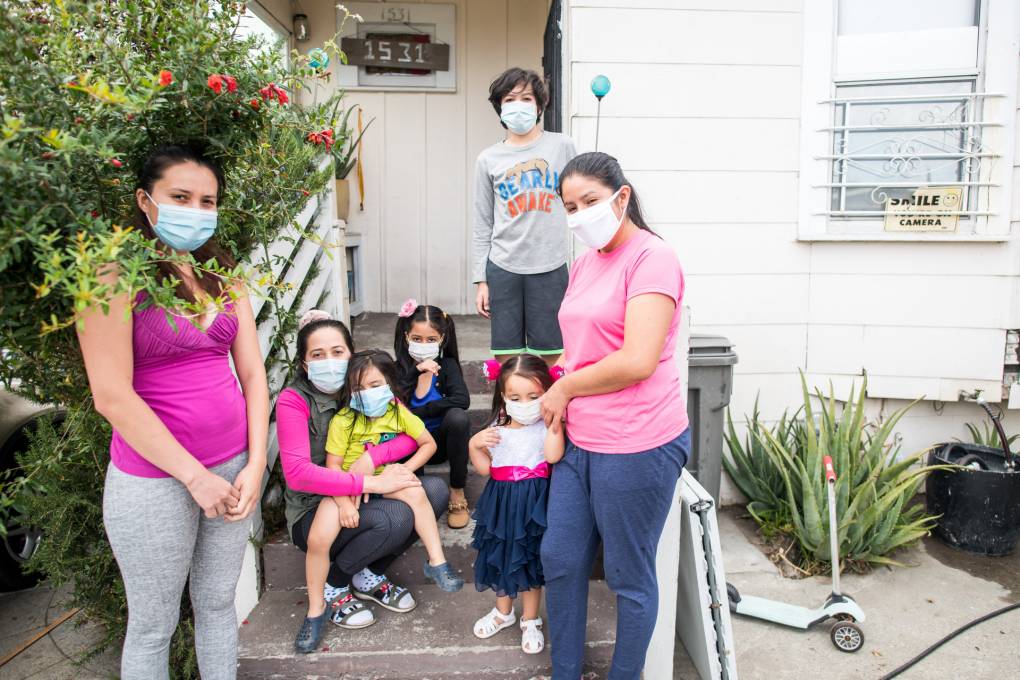
‘What Am I Going to Do?' For Families Losing Wages, Bay Area Rents Are Now a Crisis
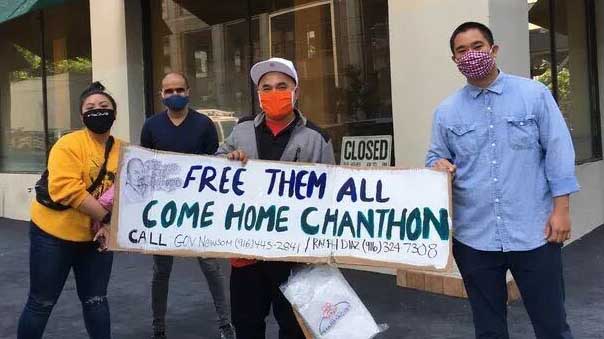
Cambodian Refugee Leaves San Quentin With COVID-19 But Avoids ICE Detention
Governor Proposes Painful Cuts to Health Care Programs to Close Budget Shortfall
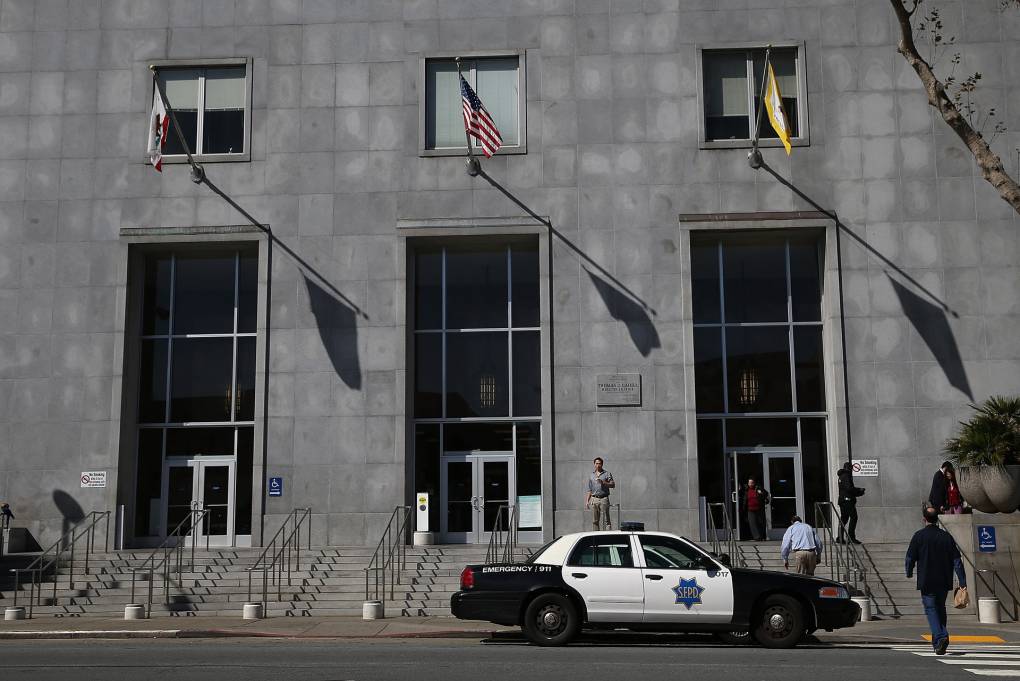
SF Officials Slam ICE for Arresting Man Outside Courthouse
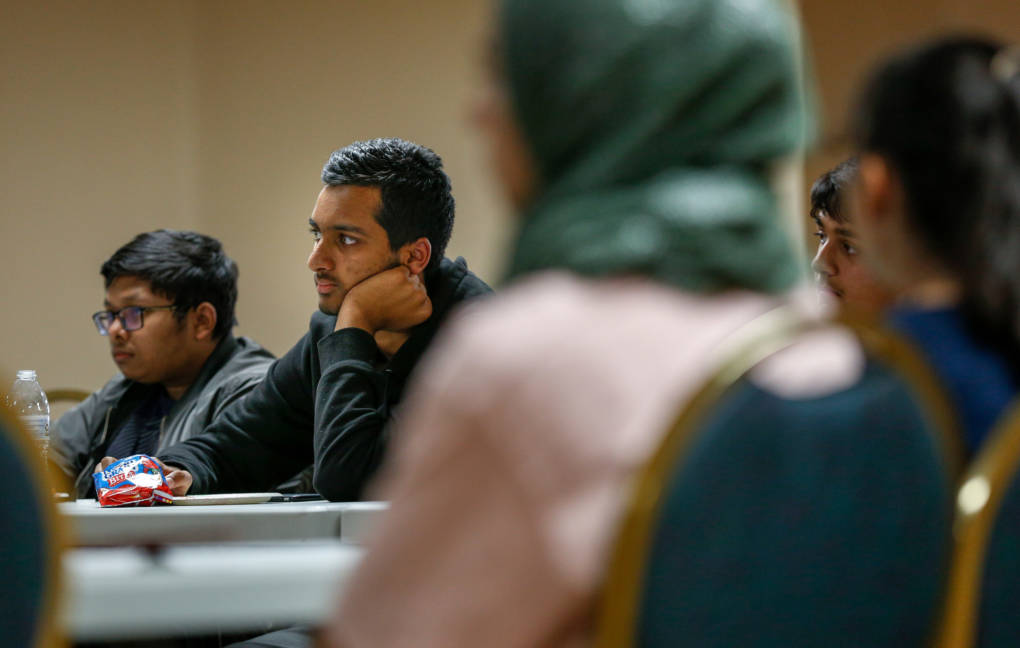
New Survey: Muslim Students in California More Likely to Be Bullied
Sponsored
window.__IS_SSR__=true
window.__INITIAL_STATE__={"attachmentsReducer":{"audio_0":{"type":"attachments","id":"audio_0","imgSizes":{"kqedFullSize":{"file":"https://ww2.kqed.org/news/wp-content/themes/KQED-unified/img/audio_bgs/background0.jpg"}}},"audio_1":{"type":"attachments","id":"audio_1","imgSizes":{"kqedFullSize":{"file":"https://ww2.kqed.org/news/wp-content/themes/KQED-unified/img/audio_bgs/background1.jpg"}}},"audio_2":{"type":"attachments","id":"audio_2","imgSizes":{"kqedFullSize":{"file":"https://ww2.kqed.org/news/wp-content/themes/KQED-unified/img/audio_bgs/background2.jpg"}}},"audio_3":{"type":"attachments","id":"audio_3","imgSizes":{"kqedFullSize":{"file":"https://ww2.kqed.org/news/wp-content/themes/KQED-unified/img/audio_bgs/background3.jpg"}}},"audio_4":{"type":"attachments","id":"audio_4","imgSizes":{"kqedFullSize":{"file":"https://ww2.kqed.org/news/wp-content/themes/KQED-unified/img/audio_bgs/background4.jpg"}}},"placeholder":{"type":"attachments","id":"placeholder","imgSizes":{"thumbnail":{"file":"https://ww2.kqed.org/wp-content/uploads/sites/10/2018/01/GettyImages-896326950-160x96.jpg","width":160,"height":96,"mimeType":"image/jpeg"},"medium":{"file":"https://ww2.kqed.org/wp-content/uploads/sites/10/2018/01/GettyImages-896326950-800x478.jpg","width":800,"height":478,"mimeType":"image/jpeg"},"large":{"file":"https://ww2.kqed.org/wp-content/uploads/sites/10/2018/01/GettyImages-896326950-1020x610.jpg","width":1020,"height":610,"mimeType":"image/jpeg"},"fd-lrg":{"file":"https://ww2.kqed.org/wp-content/uploads/sites/10/2018/01/GettyImages-896326950-1920x1148.jpg","width":1920,"height":1148,"mimeType":"image/jpeg"},"fd-med":{"file":"https://ww2.kqed.org/wp-content/uploads/sites/10/2018/01/GettyImages-896326950-1180x705.jpg","width":1180,"height":705,"mimeType":"image/jpeg"},"fd-sm":{"file":"https://ww2.kqed.org/wp-content/uploads/sites/10/2018/01/GettyImages-896326950-960x574.jpg","width":960,"height":574,"mimeType":"image/jpeg"},"post-thumbnail":{"file":"https://ww2.kqed.org/wp-content/uploads/sites/10/2018/01/GettyImages-896326950-672x372.jpg","width":672,"height":372,"mimeType":"image/jpeg"},"twentyfourteen-full-width":{"file":"https://ww2.kqed.org/wp-content/uploads/sites/10/2018/01/GettyImages-896326950-1038x576.jpg","width":1038,"height":576,"mimeType":"image/jpeg"},"xxsmall":{"file":"https://ww2.kqed.org/wp-content/uploads/sites/10/2018/01/GettyImages-896326950-240x143.jpg","width":240,"height":143,"mimeType":"image/jpeg"},"xsmall":{"file":"https://ww2.kqed.org/wp-content/uploads/sites/10/2018/01/GettyImages-896326950-375x224.jpg","width":375,"height":224,"mimeType":"image/jpeg"},"small":{"file":"https://ww2.kqed.org/wp-content/uploads/sites/10/2018/01/GettyImages-896326950-520x311.jpg","width":520,"height":311,"mimeType":"image/jpeg"},"xlarge":{"file":"https://ww2.kqed.org/wp-content/uploads/sites/10/2018/01/GettyImages-896326950-1180x705.jpg","width":1180,"height":705,"mimeType":"image/jpeg"},"full-width":{"file":"https://ww2.kqed.org/wp-content/uploads/sites/10/2018/01/GettyImages-896326950-1920x1148.jpg","width":1920,"height":1148,"mimeType":"image/jpeg"},"guest-author-32":{"file":"https://ww2.kqed.org/wp-content/uploads/sites/10/2018/01/GettyImages-896326950-32x32.jpg","width":32,"height":32,"mimeType":"image/jpeg"},"guest-author-50":{"file":"https://ww2.kqed.org/wp-content/uploads/sites/10/2018/01/GettyImages-896326950-50x50.jpg","width":50,"height":50,"mimeType":"image/jpeg"},"guest-author-64":{"file":"https://ww2.kqed.org/wp-content/uploads/sites/10/2018/01/GettyImages-896326950-64x64.jpg","width":64,"height":64,"mimeType":"image/jpeg"},"guest-author-96":{"file":"https://ww2.kqed.org/wp-content/uploads/sites/10/2018/01/GettyImages-896326950-96x96.jpg","width":96,"height":96,"mimeType":"image/jpeg"},"guest-author-128":{"file":"https://ww2.kqed.org/wp-content/uploads/sites/10/2018/01/GettyImages-896326950-128x128.jpg","width":128,"height":128,"mimeType":"image/jpeg"},"detail":{"file":"https://ww2.kqed.org/wp-content/uploads/sites/10/2018/01/GettyImages-896326950-150x150.jpg","width":150,"height":150,"mimeType":"image/jpeg"},"kqedFullSize":{"file":"https://ww2.kqed.org/wp-content/uploads/sites/10/2018/01/GettyImages-896326950-e1514998105161.jpg","width":1920,"height":1148}}},"news_11647129":{"type":"attachments","id":"news_11647129","meta":{"index":"attachments_1591205162","site":"news","id":"11647129","found":true},"title":"RS29073_eucalyptusgrove14","publishDate":1517352358,"status":"inherit","parent":11644927,"modified":1517352871,"caption":"Blue gum eucalyptus globulus grows fast and in poor soil, which made it a favorite of investors anticipating a hardwood famine in the early 1900s.","credit":"Samantha Shanahan/KQED","description":"Blue gum eucalyptus globulus grows fast and in poor soil, which made it a favorite of investors anticipating a hardwood famine in the early 1900s.","imgSizes":{"thumbnail":{"file":"https://ww2.kqed.org/app/uploads/sites/10/2018/01/RS29073_eucalyptusgrove14-160x107.jpg","width":160,"height":107,"mimeType":"image/jpeg"},"medium":{"file":"https://ww2.kqed.org/app/uploads/sites/10/2018/01/RS29073_eucalyptusgrove14-800x533.jpg","width":800,"height":533,"mimeType":"image/jpeg"},"large":{"file":"https://ww2.kqed.org/app/uploads/sites/10/2018/01/RS29073_eucalyptusgrove14-1020x680.jpg","width":1020,"height":680,"mimeType":"image/jpeg"},"fd-lrg":{"file":"https://ww2.kqed.org/app/uploads/sites/10/2018/01/RS29073_eucalyptusgrove14-1920x1280.jpg","width":1920,"height":1280,"mimeType":"image/jpeg"},"fd-med":{"file":"https://ww2.kqed.org/app/uploads/sites/10/2018/01/RS29073_eucalyptusgrove14-1180x787.jpg","width":1180,"height":787,"mimeType":"image/jpeg"},"fd-sm":{"file":"https://ww2.kqed.org/app/uploads/sites/10/2018/01/RS29073_eucalyptusgrove14-960x640.jpg","width":960,"height":640,"mimeType":"image/jpeg"},"post-thumbnail":{"file":"https://ww2.kqed.org/app/uploads/sites/10/2018/01/RS29073_eucalyptusgrove14-672x372.jpg","width":672,"height":372,"mimeType":"image/jpeg"},"twentyfourteen-full-width":{"file":"https://ww2.kqed.org/app/uploads/sites/10/2018/01/RS29073_eucalyptusgrove14-1038x576.jpg","width":1038,"height":576,"mimeType":"image/jpeg"},"xxsmall":{"file":"https://ww2.kqed.org/app/uploads/sites/10/2018/01/RS29073_eucalyptusgrove14-240x160.jpg","width":240,"height":160,"mimeType":"image/jpeg"},"xsmall":{"file":"https://ww2.kqed.org/app/uploads/sites/10/2018/01/RS29073_eucalyptusgrove14-375x250.jpg","width":375,"height":250,"mimeType":"image/jpeg"},"small":{"file":"https://ww2.kqed.org/app/uploads/sites/10/2018/01/RS29073_eucalyptusgrove14-520x347.jpg","width":520,"height":347,"mimeType":"image/jpeg"},"xlarge":{"file":"https://ww2.kqed.org/app/uploads/sites/10/2018/01/RS29073_eucalyptusgrove14-1180x787.jpg","width":1180,"height":787,"mimeType":"image/jpeg"},"full-width":{"file":"https://ww2.kqed.org/app/uploads/sites/10/2018/01/RS29073_eucalyptusgrove14-1920x1280.jpg","width":1920,"height":1280,"mimeType":"image/jpeg"},"guest-author-32":{"file":"https://ww2.kqed.org/app/uploads/sites/10/2018/01/RS29073_eucalyptusgrove14-32x32.jpg","width":32,"height":32,"mimeType":"image/jpeg"},"guest-author-50":{"file":"https://ww2.kqed.org/app/uploads/sites/10/2018/01/RS29073_eucalyptusgrove14-50x50.jpg","width":50,"height":50,"mimeType":"image/jpeg"},"guest-author-64":{"file":"https://ww2.kqed.org/app/uploads/sites/10/2018/01/RS29073_eucalyptusgrove14-64x64.jpg","width":64,"height":64,"mimeType":"image/jpeg"},"guest-author-96":{"file":"https://ww2.kqed.org/app/uploads/sites/10/2018/01/RS29073_eucalyptusgrove14-96x96.jpg","width":96,"height":96,"mimeType":"image/jpeg"},"guest-author-128":{"file":"https://ww2.kqed.org/app/uploads/sites/10/2018/01/RS29073_eucalyptusgrove14-128x128.jpg","width":128,"height":128,"mimeType":"image/jpeg"},"detail":{"file":"https://ww2.kqed.org/app/uploads/sites/10/2018/01/RS29073_eucalyptusgrove14-150x150.jpg","width":150,"height":150,"mimeType":"image/jpeg"},"kqedFullSize":{"file":"https://ww2.kqed.org/app/uploads/sites/10/2018/01/RS29073_eucalyptusgrove14-e1517539029317.jpg","width":1920,"height":1280}},"fetchFailed":false,"isLoading":false},"news_10795862":{"type":"attachments","id":"news_10795862","meta":{"index":"attachments_1591205162","site":"news","id":"10795862","found":true},"title":"Dig","publishDate":1450228012,"status":"inherit","parent":10779164,"modified":1450295952,"caption":"Workers remove bodies from a San Francisco graveyard. ","credit":"Colma Historical Association","description":"Workers remove bodies from a San Francisco graveyard. ","imgSizes":{"thumbnail":{"file":"https://ww2.kqed.org/app/uploads/sites/10/2026/12/exhume-400x338.jpg","width":400,"height":338,"mimeType":"image/jpeg"},"medium":{"file":"https://ww2.kqed.org/app/uploads/sites/10/2026/12/exhume-800x677.jpg","width":800,"height":677,"mimeType":"image/jpeg"},"medium_large":{"file":"https://ww2.kqed.org/app/uploads/sites/10/2026/12/exhume-768x649.jpg","width":768,"height":649,"mimeType":"image/jpeg"},"large":{"file":"https://ww2.kqed.org/app/uploads/sites/10/2026/12/exhume-1440x1218.jpg","width":1440,"height":1218,"mimeType":"image/jpeg"},"fd-lrg":{"file":"https://ww2.kqed.org/app/uploads/sites/10/2026/12/exhume-1920x1624.jpg","width":1920,"height":1624,"mimeType":"image/jpeg"},"fd-med":{"file":"https://ww2.kqed.org/app/uploads/sites/10/2026/12/exhume-1180x998.jpg","width":1180,"height":998,"mimeType":"image/jpeg"},"fd-sm":{"file":"https://ww2.kqed.org/app/uploads/sites/10/2026/12/exhume-960x812.jpg","width":960,"height":812,"mimeType":"image/jpeg"},"post-thumbnail":{"file":"https://ww2.kqed.org/app/uploads/sites/10/2026/12/exhume-672x372.jpg","width":672,"height":372,"mimeType":"image/jpeg"},"twentyfourteen-full-width":{"file":"https://ww2.kqed.org/app/uploads/sites/10/2026/12/exhume-1038x576.jpg","width":1038,"height":576,"mimeType":"image/jpeg"},"guest-author-32":{"file":"https://ww2.kqed.org/app/uploads/sites/10/2026/12/exhume-32x32.jpg","width":32,"height":32,"mimeType":"image/jpeg"},"guest-author-64":{"file":"https://ww2.kqed.org/app/uploads/sites/10/2026/12/exhume-64x64.jpg","width":64,"height":64,"mimeType":"image/jpeg"},"guest-author-96":{"file":"https://ww2.kqed.org/app/uploads/sites/10/2026/12/exhume-96x96.jpg","width":96,"height":96,"mimeType":"image/jpeg"},"guest-author-128":{"file":"https://ww2.kqed.org/app/uploads/sites/10/2026/12/exhume-128x128.jpg","width":128,"height":128,"mimeType":"image/jpeg"},"detail":{"file":"https://ww2.kqed.org/app/uploads/sites/10/2026/12/exhume-75x75.jpg","width":75,"height":75,"mimeType":"image/jpeg"},"jmtc-small-thumb":{"file":"https://ww2.kqed.org/app/uploads/sites/10/2026/12/exhume-280x150.jpg","width":280,"height":150,"mimeType":"image/jpeg"},"kqedFullSize":{"file":"https://ww2.kqed.org/app/uploads/sites/10/2026/12/exhume.jpg","width":3356,"height":2838}},"fetchFailed":false,"isLoading":false},"news_11844647":{"type":"attachments","id":"news_11844647","meta":{"index":"attachments_1591205162","site":"news","id":"11844647","found":true},"title":"RS45478_026_KQED_Oakland_RegistrarofVoters_10272020-qut","publishDate":1604089578,"status":"inherit","parent":11844635,"modified":1604167074,"caption":"Henok Welday and his son Nathan drop off a mail-in ballot on Oct. 27, 2020 at an official drop box set up by the Alameda County Registrar of Voters in Oakland.","credit":"Beth LaBerge/KQED","description":"Henok Welday and his son Nathan drop off a mail-in ballot on on Oct. 27, 2020 at an official drop box set up by the Alameda County Registrar of Voters in Oakland.","imgSizes":{"medium":{"file":"https://ww2.kqed.org/app/uploads/sites/10/2020/10/RS45478_026_KQED_Oakland_RegistrarofVoters_10272020-qut-800x533.jpg","width":800,"height":533,"mimeType":"image/jpeg"},"large":{"file":"https://ww2.kqed.org/app/uploads/sites/10/2020/10/RS45478_026_KQED_Oakland_RegistrarofVoters_10272020-qut-1020x680.jpg","width":1020,"height":680,"mimeType":"image/jpeg"},"thumbnail":{"file":"https://ww2.kqed.org/app/uploads/sites/10/2020/10/RS45478_026_KQED_Oakland_RegistrarofVoters_10272020-qut-160x107.jpg","width":160,"height":107,"mimeType":"image/jpeg"},"1536x1536":{"file":"https://ww2.kqed.org/app/uploads/sites/10/2020/10/RS45478_026_KQED_Oakland_RegistrarofVoters_10272020-qut-1536x1024.jpg","width":1536,"height":1024,"mimeType":"image/jpeg"},"post-thumbnail":{"file":"https://ww2.kqed.org/app/uploads/sites/10/2020/10/RS45478_026_KQED_Oakland_RegistrarofVoters_10272020-qut-672x372.jpg","width":672,"height":372,"mimeType":"image/jpeg"},"twentyfourteen-full-width":{"file":"https://ww2.kqed.org/app/uploads/sites/10/2020/10/RS45478_026_KQED_Oakland_RegistrarofVoters_10272020-qut-1038x576.jpg","width":1038,"height":576,"mimeType":"image/jpeg"},"apple_news_ca_landscape_12_9":{"file":"https://ww2.kqed.org/app/uploads/sites/10/2020/10/RS45478_026_KQED_Oakland_RegistrarofVoters_10272020-qut-1832x1280.jpg","width":1832,"height":1280,"mimeType":"image/jpeg"},"apple_news_ca_landscape_9_7":{"file":"https://ww2.kqed.org/app/uploads/sites/10/2020/10/RS45478_026_KQED_Oakland_RegistrarofVoters_10272020-qut-1376x1032.jpg","width":1376,"height":1032,"mimeType":"image/jpeg"},"apple_news_ca_landscape_5_5":{"file":"https://ww2.kqed.org/app/uploads/sites/10/2020/10/RS45478_026_KQED_Oakland_RegistrarofVoters_10272020-qut-1044x783.jpg","width":1044,"height":783,"mimeType":"image/jpeg"},"apple_news_ca_landscape_4_7":{"file":"https://ww2.kqed.org/app/uploads/sites/10/2020/10/RS45478_026_KQED_Oakland_RegistrarofVoters_10272020-qut-632x474.jpg","width":632,"height":474,"mimeType":"image/jpeg"},"apple_news_ca_landscape_4_0":{"file":"https://ww2.kqed.org/app/uploads/sites/10/2020/10/RS45478_026_KQED_Oakland_RegistrarofVoters_10272020-qut-536x402.jpg","width":536,"height":402,"mimeType":"image/jpeg"},"apple_news_ca_portrait_12_9":{"file":"https://ww2.kqed.org/app/uploads/sites/10/2020/10/RS45478_026_KQED_Oakland_RegistrarofVoters_10272020-qut-1122x1280.jpg","width":1122,"height":1280,"mimeType":"image/jpeg"},"apple_news_ca_portrait_9_7":{"file":"https://ww2.kqed.org/app/uploads/sites/10/2020/10/RS45478_026_KQED_Oakland_RegistrarofVoters_10272020-qut-840x1120.jpg","width":840,"height":1120,"mimeType":"image/jpeg"},"apple_news_ca_portrait_5_5":{"file":"https://ww2.kqed.org/app/uploads/sites/10/2020/10/RS45478_026_KQED_Oakland_RegistrarofVoters_10272020-qut-687x916.jpg","width":687,"height":916,"mimeType":"image/jpeg"},"apple_news_ca_portrait_4_7":{"file":"https://ww2.kqed.org/app/uploads/sites/10/2020/10/RS45478_026_KQED_Oakland_RegistrarofVoters_10272020-qut-414x552.jpg","width":414,"height":552,"mimeType":"image/jpeg"},"apple_news_ca_portrait_4_0":{"file":"https://ww2.kqed.org/app/uploads/sites/10/2020/10/RS45478_026_KQED_Oakland_RegistrarofVoters_10272020-qut-354x472.jpg","width":354,"height":472,"mimeType":"image/jpeg"},"apple_news_ca_square_12_9":{"file":"https://ww2.kqed.org/app/uploads/sites/10/2020/10/RS45478_026_KQED_Oakland_RegistrarofVoters_10272020-qut-1472x1280.jpg","width":1472,"height":1280,"mimeType":"image/jpeg"},"apple_news_ca_square_9_7":{"file":"https://ww2.kqed.org/app/uploads/sites/10/2020/10/RS45478_026_KQED_Oakland_RegistrarofVoters_10272020-qut-1104x1104.jpg","width":1104,"height":1104,"mimeType":"image/jpeg"},"apple_news_ca_square_5_5":{"file":"https://ww2.kqed.org/app/uploads/sites/10/2020/10/RS45478_026_KQED_Oakland_RegistrarofVoters_10272020-qut-912x912.jpg","width":912,"height":912,"mimeType":"image/jpeg"},"apple_news_ca_square_4_7":{"file":"https://ww2.kqed.org/app/uploads/sites/10/2020/10/RS45478_026_KQED_Oakland_RegistrarofVoters_10272020-qut-550x550.jpg","width":550,"height":550,"mimeType":"image/jpeg"},"apple_news_ca_square_4_0":{"file":"https://ww2.kqed.org/app/uploads/sites/10/2020/10/RS45478_026_KQED_Oakland_RegistrarofVoters_10272020-qut-470x470.jpg","width":470,"height":470,"mimeType":"image/jpeg"},"kqedFullSize":{"file":"https://ww2.kqed.org/app/uploads/sites/10/2020/10/RS45478_026_KQED_Oakland_RegistrarofVoters_10272020-qut.jpg","width":1920,"height":1280}},"fetchFailed":false,"isLoading":false},"news_11223334":{"type":"attachments","id":"news_11223334","meta":{"index":"attachments_1591205162","site":"news","id":"11223334","found":true},"title":"electoralvotes","publishDate":1481920335,"status":"inherit","parent":11221817,"modified":1481927537,"caption":"Congressional clerks help unseal and organize the Electoral College votes from all 50 states in the U.S. House of Representatives on Jan. 4, 2013. ","credit":"Chip Somodevilla/Getty Images","description":"Congressional clerks help unseal and organize the Electoral College votes from all 50 states in the U.S. House of Representatives on January 4, 2013. ","imgSizes":{"thumbnail":{"file":"https://ww2.kqed.org/app/uploads/sites/10/2016/12/ElectoralVotes-160x103.jpg","width":160,"height":103,"mimeType":"image/jpeg"},"medium":{"file":"https://ww2.kqed.org/app/uploads/sites/10/2016/12/ElectoralVotes-800x514.jpg","width":800,"height":514,"mimeType":"image/jpeg"},"large":{"file":"https://ww2.kqed.org/app/uploads/sites/10/2016/12/ElectoralVotes-1020x655.jpg","width":1020,"height":655,"mimeType":"image/jpeg"},"fd-lrg":{"file":"https://ww2.kqed.org/app/uploads/sites/10/2016/12/ElectoralVotes-1920x1233.jpg","width":1920,"height":1233,"mimeType":"image/jpeg"},"fd-med":{"file":"https://ww2.kqed.org/app/uploads/sites/10/2016/12/ElectoralVotes-1180x758.jpg","width":1180,"height":758,"mimeType":"image/jpeg"},"fd-sm":{"file":"https://ww2.kqed.org/app/uploads/sites/10/2016/12/ElectoralVotes-960x617.jpg","width":960,"height":617,"mimeType":"image/jpeg"},"post-thumbnail":{"file":"https://ww2.kqed.org/app/uploads/sites/10/2016/12/ElectoralVotes-672x372.jpg","width":672,"height":372,"mimeType":"image/jpeg"},"twentyfourteen-full-width":{"file":"https://ww2.kqed.org/app/uploads/sites/10/2016/12/ElectoralVotes-1038x576.jpg","width":1038,"height":576,"mimeType":"image/jpeg"},"xxsmall":{"file":"https://ww2.kqed.org/app/uploads/sites/10/2016/12/ElectoralVotes-240x154.jpg","width":240,"height":154,"mimeType":"image/jpeg"},"xsmall":{"file":"https://ww2.kqed.org/app/uploads/sites/10/2016/12/ElectoralVotes-375x241.jpg","width":375,"height":241,"mimeType":"image/jpeg"},"small":{"file":"https://ww2.kqed.org/app/uploads/sites/10/2016/12/ElectoralVotes-520x334.jpg","width":520,"height":334,"mimeType":"image/jpeg"},"xlarge":{"file":"https://ww2.kqed.org/app/uploads/sites/10/2016/12/ElectoralVotes-1180x758.jpg","width":1180,"height":758,"mimeType":"image/jpeg"},"full-width":{"file":"https://ww2.kqed.org/app/uploads/sites/10/2016/12/ElectoralVotes-1920x1233.jpg","width":1920,"height":1233,"mimeType":"image/jpeg"},"guest-author-32":{"file":"https://ww2.kqed.org/app/uploads/sites/10/2016/12/ElectoralVotes-32x32.jpg","width":32,"height":32,"mimeType":"image/jpeg"},"guest-author-50":{"file":"https://ww2.kqed.org/app/uploads/sites/10/2016/12/ElectoralVotes-50x50.jpg","width":50,"height":50,"mimeType":"image/jpeg"},"guest-author-64":{"file":"https://ww2.kqed.org/app/uploads/sites/10/2016/12/ElectoralVotes-64x64.jpg","width":64,"height":64,"mimeType":"image/jpeg"},"guest-author-96":{"file":"https://ww2.kqed.org/app/uploads/sites/10/2016/12/ElectoralVotes-96x96.jpg","width":96,"height":96,"mimeType":"image/jpeg"},"guest-author-128":{"file":"https://ww2.kqed.org/app/uploads/sites/10/2016/12/ElectoralVotes-128x128.jpg","width":128,"height":128,"mimeType":"image/jpeg"},"detail":{"file":"https://ww2.kqed.org/app/uploads/sites/10/2016/12/ElectoralVotes-150x150.jpg","width":150,"height":150,"mimeType":"image/jpeg"},"jmtc-small-thumb":{"file":"https://ww2.kqed.org/app/uploads/sites/10/2016/12/ElectoralVotes-280x150.jpg","width":280,"height":150,"mimeType":"image/jpeg"},"kqedFullSize":{"file":"https://ww2.kqed.org/app/uploads/sites/10/2016/12/ElectoralVotes.jpg","width":1920,"height":1233}},"fetchFailed":false,"isLoading":false},"news_11835783":{"type":"attachments","id":"news_11835783","meta":{"index":"attachments_1591205162","site":"news","id":"11835783","found":true},"title":"evictionmoratorium","publishDate":1598640347,"status":"inherit","parent":0,"modified":1598642026,"caption":"Aleyda Rebelo (second from left) with her family at their home in Oakland on Aug. 26, 2020.","credit":"Beth LaBerge/KQED","description":null,"imgSizes":{"medium":{"file":"https://ww2.kqed.org/app/uploads/sites/10/2020/08/RS44638_016_KQED_Oakland_AleydaRebelo_08262020-qut-800x533.jpg","width":800,"height":533,"mimeType":"image/jpeg"},"large":{"file":"https://ww2.kqed.org/app/uploads/sites/10/2020/08/RS44638_016_KQED_Oakland_AleydaRebelo_08262020-qut-1020x680.jpg","width":1020,"height":680,"mimeType":"image/jpeg"},"thumbnail":{"file":"https://ww2.kqed.org/app/uploads/sites/10/2020/08/RS44638_016_KQED_Oakland_AleydaRebelo_08262020-qut-160x107.jpg","width":160,"height":107,"mimeType":"image/jpeg"},"1536x1536":{"file":"https://ww2.kqed.org/app/uploads/sites/10/2020/08/RS44638_016_KQED_Oakland_AleydaRebelo_08262020-qut-1536x1024.jpg","width":1536,"height":1024,"mimeType":"image/jpeg"},"post-thumbnail":{"file":"https://ww2.kqed.org/app/uploads/sites/10/2020/08/RS44638_016_KQED_Oakland_AleydaRebelo_08262020-qut-672x372.jpg","width":672,"height":372,"mimeType":"image/jpeg"},"twentyfourteen-full-width":{"file":"https://ww2.kqed.org/app/uploads/sites/10/2020/08/RS44638_016_KQED_Oakland_AleydaRebelo_08262020-qut-1038x576.jpg","width":1038,"height":576,"mimeType":"image/jpeg"},"apple_news_ca_landscape_12_9":{"file":"https://ww2.kqed.org/app/uploads/sites/10/2020/08/RS44638_016_KQED_Oakland_AleydaRebelo_08262020-qut-1832x1280.jpg","width":1832,"height":1280,"mimeType":"image/jpeg"},"apple_news_ca_landscape_9_7":{"file":"https://ww2.kqed.org/app/uploads/sites/10/2020/08/RS44638_016_KQED_Oakland_AleydaRebelo_08262020-qut-1376x1032.jpg","width":1376,"height":1032,"mimeType":"image/jpeg"},"apple_news_ca_landscape_5_5":{"file":"https://ww2.kqed.org/app/uploads/sites/10/2020/08/RS44638_016_KQED_Oakland_AleydaRebelo_08262020-qut-1044x783.jpg","width":1044,"height":783,"mimeType":"image/jpeg"},"apple_news_ca_landscape_4_7":{"file":"https://ww2.kqed.org/app/uploads/sites/10/2020/08/RS44638_016_KQED_Oakland_AleydaRebelo_08262020-qut-632x474.jpg","width":632,"height":474,"mimeType":"image/jpeg"},"apple_news_ca_landscape_4_0":{"file":"https://ww2.kqed.org/app/uploads/sites/10/2020/08/RS44638_016_KQED_Oakland_AleydaRebelo_08262020-qut-536x402.jpg","width":536,"height":402,"mimeType":"image/jpeg"},"apple_news_ca_portrait_12_9":{"file":"https://ww2.kqed.org/app/uploads/sites/10/2020/08/RS44638_016_KQED_Oakland_AleydaRebelo_08262020-qut-1122x1280.jpg","width":1122,"height":1280,"mimeType":"image/jpeg"},"apple_news_ca_portrait_9_7":{"file":"https://ww2.kqed.org/app/uploads/sites/10/2020/08/RS44638_016_KQED_Oakland_AleydaRebelo_08262020-qut-840x1120.jpg","width":840,"height":1120,"mimeType":"image/jpeg"},"apple_news_ca_portrait_5_5":{"file":"https://ww2.kqed.org/app/uploads/sites/10/2020/08/RS44638_016_KQED_Oakland_AleydaRebelo_08262020-qut-687x916.jpg","width":687,"height":916,"mimeType":"image/jpeg"},"apple_news_ca_portrait_4_7":{"file":"https://ww2.kqed.org/app/uploads/sites/10/2020/08/RS44638_016_KQED_Oakland_AleydaRebelo_08262020-qut-414x552.jpg","width":414,"height":552,"mimeType":"image/jpeg"},"apple_news_ca_portrait_4_0":{"file":"https://ww2.kqed.org/app/uploads/sites/10/2020/08/RS44638_016_KQED_Oakland_AleydaRebelo_08262020-qut-354x472.jpg","width":354,"height":472,"mimeType":"image/jpeg"},"apple_news_ca_square_12_9":{"file":"https://ww2.kqed.org/app/uploads/sites/10/2020/08/RS44638_016_KQED_Oakland_AleydaRebelo_08262020-qut-1472x1280.jpg","width":1472,"height":1280,"mimeType":"image/jpeg"},"apple_news_ca_square_9_7":{"file":"https://ww2.kqed.org/app/uploads/sites/10/2020/08/RS44638_016_KQED_Oakland_AleydaRebelo_08262020-qut-1104x1104.jpg","width":1104,"height":1104,"mimeType":"image/jpeg"},"apple_news_ca_square_5_5":{"file":"https://ww2.kqed.org/app/uploads/sites/10/2020/08/RS44638_016_KQED_Oakland_AleydaRebelo_08262020-qut-912x912.jpg","width":912,"height":912,"mimeType":"image/jpeg"},"apple_news_ca_square_4_7":{"file":"https://ww2.kqed.org/app/uploads/sites/10/2020/08/RS44638_016_KQED_Oakland_AleydaRebelo_08262020-qut-550x550.jpg","width":550,"height":550,"mimeType":"image/jpeg"},"apple_news_ca_square_4_0":{"file":"https://ww2.kqed.org/app/uploads/sites/10/2020/08/RS44638_016_KQED_Oakland_AleydaRebelo_08262020-qut-470x470.jpg","width":470,"height":470,"mimeType":"image/jpeg"},"kqedFullSize":{"file":"https://ww2.kqed.org/app/uploads/sites/10/2020/08/RS44638_016_KQED_Oakland_AleydaRebelo_08262020-qut.jpg","width":1920,"height":1280}},"fetchFailed":false,"isLoading":false},"news_11827394":{"type":"attachments","id":"news_11827394","meta":{"index":"attachments_1591205162","site":"news","id":"11827394","found":true},"title":"1920_sign","publishDate":1593743078,"status":"inherit","parent":11827388,"modified":1593743444,"caption":"Chanthon Bun, in orange mask, is greeted by supporters in San Francisco Wednesday after being released from San Quentin State Prison. Bun was relieved he had not been transferred to ICE but learned later in the day that he had been infected with COVID-19 while in prison.","credit":"Courtesy of Anoop Prasad","description":null,"imgSizes":{"thumbnail":{"file":"https://ww2.kqed.org/app/uploads/sites/10/2020/07/1920_sign-160x90.jpg","width":160,"height":90,"mimeType":"image/jpeg"},"apple_news_ca_landscape_4_0":{"file":"https://ww2.kqed.org/app/uploads/sites/10/2020/07/1920_sign-536x339.jpg","width":536,"height":339,"mimeType":"image/jpeg"},"apple_news_ca_portrait_4_7":{"file":"https://ww2.kqed.org/app/uploads/sites/10/2020/07/1920_sign-414x339.jpg","width":414,"height":339,"mimeType":"image/jpeg"},"apple_news_ca_portrait_4_0":{"file":"https://ww2.kqed.org/app/uploads/sites/10/2020/07/1920_sign-354x339.jpg","width":354,"height":339,"mimeType":"image/jpeg"},"apple_news_ca_square_4_7":{"file":"https://ww2.kqed.org/app/uploads/sites/10/2020/07/1920_sign-550x339.jpg","width":550,"height":339,"mimeType":"image/jpeg"},"apple_news_ca_square_4_0":{"file":"https://ww2.kqed.org/app/uploads/sites/10/2020/07/1920_sign-470x339.jpg","width":470,"height":339,"mimeType":"image/jpeg"},"kqedFullSize":{"file":"https://ww2.kqed.org/app/uploads/sites/10/2020/07/1920_sign.jpg","width":604,"height":339}},"fetchFailed":false,"isLoading":false},"news_11818533":{"type":"attachments","id":"news_11818533","meta":{"index":"attachments_1591205162","site":"news","id":"11818533","found":true},"title":"RS42005_005_KQED_SanFrancisco_UCSF_03112020_6951-qut","publishDate":1589511850,"status":"inherit","parent":11818524,"modified":1589511887,"caption":"Tents are set up outside of the UCSF Parnassus campus in San Francisco to triage patients with respiratory illness, on Mar. 11, 2020.","credit":"Beth LaBerge/KQED","description":null,"imgSizes":{"thumbnail":{"file":"https://ww2.kqed.org/app/uploads/sites/10/2020/05/RS42005_005_KQED_SanFrancisco_UCSF_03112020_6951-qut-160x107.jpg","width":160,"height":107,"mimeType":"image/jpeg"},"medium":{"file":"https://ww2.kqed.org/app/uploads/sites/10/2020/05/RS42005_005_KQED_SanFrancisco_UCSF_03112020_6951-qut-800x533.jpg","width":800,"height":533,"mimeType":"image/jpeg"},"large":{"file":"https://ww2.kqed.org/app/uploads/sites/10/2020/05/RS42005_005_KQED_SanFrancisco_UCSF_03112020_6951-qut-1020x680.jpg","width":1020,"height":680,"mimeType":"image/jpeg"},"post-thumbnail":{"file":"https://ww2.kqed.org/app/uploads/sites/10/2020/05/RS42005_005_KQED_SanFrancisco_UCSF_03112020_6951-qut-672x372.jpg","width":672,"height":372,"mimeType":"image/jpeg"},"twentyfourteen-full-width":{"file":"https://ww2.kqed.org/app/uploads/sites/10/2020/05/RS42005_005_KQED_SanFrancisco_UCSF_03112020_6951-qut-1038x576.jpg","width":1038,"height":576,"mimeType":"image/jpeg"},"full-width":{"file":"https://ww2.kqed.org/app/uploads/sites/10/2020/05/RS42005_005_KQED_SanFrancisco_UCSF_03112020_6951-qut-1920x1280.jpg","width":1920,"height":1280,"mimeType":"image/jpeg"},"apple_news_ca_landscape_12_9":{"file":"https://ww2.kqed.org/app/uploads/sites/10/2020/05/RS42005_005_KQED_SanFrancisco_UCSF_03112020_6951-qut-1832x1280.jpg","width":1832,"height":1280,"mimeType":"image/jpeg"},"apple_news_ca_landscape_9_7":{"file":"https://ww2.kqed.org/app/uploads/sites/10/2020/05/RS42005_005_KQED_SanFrancisco_UCSF_03112020_6951-qut-1376x1032.jpg","width":1376,"height":1032,"mimeType":"image/jpeg"},"apple_news_ca_landscape_5_5":{"file":"https://ww2.kqed.org/app/uploads/sites/10/2020/05/RS42005_005_KQED_SanFrancisco_UCSF_03112020_6951-qut-1044x783.jpg","width":1044,"height":783,"mimeType":"image/jpeg"},"apple_news_ca_landscape_4_7":{"file":"https://ww2.kqed.org/app/uploads/sites/10/2020/05/RS42005_005_KQED_SanFrancisco_UCSF_03112020_6951-qut-632x474.jpg","width":632,"height":474,"mimeType":"image/jpeg"},"apple_news_ca_landscape_4_0":{"file":"https://ww2.kqed.org/app/uploads/sites/10/2020/05/RS42005_005_KQED_SanFrancisco_UCSF_03112020_6951-qut-536x402.jpg","width":536,"height":402,"mimeType":"image/jpeg"},"apple_news_ca_portrait_12_9":{"file":"https://ww2.kqed.org/app/uploads/sites/10/2020/05/RS42005_005_KQED_SanFrancisco_UCSF_03112020_6951-qut-1122x1280.jpg","width":1122,"height":1280,"mimeType":"image/jpeg"},"apple_news_ca_portrait_9_7":{"file":"https://ww2.kqed.org/app/uploads/sites/10/2020/05/RS42005_005_KQED_SanFrancisco_UCSF_03112020_6951-qut-840x1120.jpg","width":840,"height":1120,"mimeType":"image/jpeg"},"apple_news_ca_portrait_5_5":{"file":"https://ww2.kqed.org/app/uploads/sites/10/2020/05/RS42005_005_KQED_SanFrancisco_UCSF_03112020_6951-qut-687x916.jpg","width":687,"height":916,"mimeType":"image/jpeg"},"apple_news_ca_portrait_4_7":{"file":"https://ww2.kqed.org/app/uploads/sites/10/2020/05/RS42005_005_KQED_SanFrancisco_UCSF_03112020_6951-qut-414x552.jpg","width":414,"height":552,"mimeType":"image/jpeg"},"apple_news_ca_portrait_4_0":{"file":"https://ww2.kqed.org/app/uploads/sites/10/2020/05/RS42005_005_KQED_SanFrancisco_UCSF_03112020_6951-qut-354x472.jpg","width":354,"height":472,"mimeType":"image/jpeg"},"apple_news_ca_square_12_9":{"file":"https://ww2.kqed.org/app/uploads/sites/10/2020/05/RS42005_005_KQED_SanFrancisco_UCSF_03112020_6951-qut-1472x1280.jpg","width":1472,"height":1280,"mimeType":"image/jpeg"},"apple_news_ca_square_9_7":{"file":"https://ww2.kqed.org/app/uploads/sites/10/2020/05/RS42005_005_KQED_SanFrancisco_UCSF_03112020_6951-qut-1104x1104.jpg","width":1104,"height":1104,"mimeType":"image/jpeg"},"apple_news_ca_square_5_5":{"file":"https://ww2.kqed.org/app/uploads/sites/10/2020/05/RS42005_005_KQED_SanFrancisco_UCSF_03112020_6951-qut-912x912.jpg","width":912,"height":912,"mimeType":"image/jpeg"},"apple_news_ca_square_4_7":{"file":"https://ww2.kqed.org/app/uploads/sites/10/2020/05/RS42005_005_KQED_SanFrancisco_UCSF_03112020_6951-qut-550x550.jpg","width":550,"height":550,"mimeType":"image/jpeg"},"apple_news_ca_square_4_0":{"file":"https://ww2.kqed.org/app/uploads/sites/10/2020/05/RS42005_005_KQED_SanFrancisco_UCSF_03112020_6951-qut-470x470.jpg","width":470,"height":470,"mimeType":"image/jpeg"},"kqedFullSize":{"file":"https://ww2.kqed.org/app/uploads/sites/10/2020/05/RS42005_005_KQED_SanFrancisco_UCSF_03112020_6951-qut.jpg","width":1920,"height":1280}},"fetchFailed":false,"isLoading":false},"news_11805615":{"type":"attachments","id":"news_11805615","meta":{"index":"attachments_1591205162","site":"news","id":"11805615","found":true},"title":"RS14516_475371681-qut","publishDate":1583521455,"status":"inherit","parent":11805573,"modified":1583521569,"caption":"The San Francisco resident was on his way to a court hearing at the San Francisco Hall of Justice when he was arrested by Immigration and Customs Enforcement agents — the first such arrest in the city, according to the public defender’s office.","credit":"Justin Sullivan/Getty Images","description":"The San Francisco resident was on his way to a court hearing at the San Francisco Hall of Justice when he was arrested by Immigration and Customs Enforcement agents — the first such arrest in the city, according to the public defender’s office.","imgSizes":{"thumbnail":{"file":"https://ww2.kqed.org/app/uploads/sites/10/2020/03/RS14516_475371681-qut-160x107.jpg","width":160,"height":107,"mimeType":"image/jpeg"},"medium":{"file":"https://ww2.kqed.org/app/uploads/sites/10/2020/03/RS14516_475371681-qut-800x534.jpg","width":800,"height":534,"mimeType":"image/jpeg"},"large":{"file":"https://ww2.kqed.org/app/uploads/sites/10/2020/03/RS14516_475371681-qut-1020x681.jpg","width":1020,"height":681,"mimeType":"image/jpeg"},"post-thumbnail":{"file":"https://ww2.kqed.org/app/uploads/sites/10/2020/03/RS14516_475371681-qut-672x372.jpg","width":672,"height":372,"mimeType":"image/jpeg"},"twentyfourteen-full-width":{"file":"https://ww2.kqed.org/app/uploads/sites/10/2020/03/RS14516_475371681-qut-1038x576.jpg","width":1038,"height":576,"mimeType":"image/jpeg"},"full-width":{"file":"https://ww2.kqed.org/app/uploads/sites/10/2020/03/RS14516_475371681-qut-1920x1281.jpg","width":1920,"height":1281,"mimeType":"image/jpeg"},"apple_news_ca_landscape_12_9":{"file":"https://ww2.kqed.org/app/uploads/sites/10/2020/03/RS14516_475371681-qut-1832x1281.jpg","width":1832,"height":1281,"mimeType":"image/jpeg"},"apple_news_ca_landscape_9_7":{"file":"https://ww2.kqed.org/app/uploads/sites/10/2020/03/RS14516_475371681-qut-1376x1032.jpg","width":1376,"height":1032,"mimeType":"image/jpeg"},"apple_news_ca_landscape_5_5":{"file":"https://ww2.kqed.org/app/uploads/sites/10/2020/03/RS14516_475371681-qut-1044x783.jpg","width":1044,"height":783,"mimeType":"image/jpeg"},"apple_news_ca_landscape_4_7":{"file":"https://ww2.kqed.org/app/uploads/sites/10/2020/03/RS14516_475371681-qut-632x474.jpg","width":632,"height":474,"mimeType":"image/jpeg"},"apple_news_ca_landscape_4_0":{"file":"https://ww2.kqed.org/app/uploads/sites/10/2020/03/RS14516_475371681-qut-536x402.jpg","width":536,"height":402,"mimeType":"image/jpeg"},"apple_news_ca_portrait_12_9":{"file":"https://ww2.kqed.org/app/uploads/sites/10/2020/03/RS14516_475371681-qut-1122x1281.jpg","width":1122,"height":1281,"mimeType":"image/jpeg"},"apple_news_ca_portrait_9_7":{"file":"https://ww2.kqed.org/app/uploads/sites/10/2020/03/RS14516_475371681-qut-840x1120.jpg","width":840,"height":1120,"mimeType":"image/jpeg"},"apple_news_ca_portrait_5_5":{"file":"https://ww2.kqed.org/app/uploads/sites/10/2020/03/RS14516_475371681-qut-687x916.jpg","width":687,"height":916,"mimeType":"image/jpeg"},"apple_news_ca_portrait_4_7":{"file":"https://ww2.kqed.org/app/uploads/sites/10/2020/03/RS14516_475371681-qut-414x552.jpg","width":414,"height":552,"mimeType":"image/jpeg"},"apple_news_ca_portrait_4_0":{"file":"https://ww2.kqed.org/app/uploads/sites/10/2020/03/RS14516_475371681-qut-354x472.jpg","width":354,"height":472,"mimeType":"image/jpeg"},"apple_news_ca_square_12_9":{"file":"https://ww2.kqed.org/app/uploads/sites/10/2020/03/RS14516_475371681-qut-1472x1281.jpg","width":1472,"height":1281,"mimeType":"image/jpeg"},"apple_news_ca_square_9_7":{"file":"https://ww2.kqed.org/app/uploads/sites/10/2020/03/RS14516_475371681-qut-1104x1104.jpg","width":1104,"height":1104,"mimeType":"image/jpeg"},"apple_news_ca_square_5_5":{"file":"https://ww2.kqed.org/app/uploads/sites/10/2020/03/RS14516_475371681-qut-912x912.jpg","width":912,"height":912,"mimeType":"image/jpeg"},"apple_news_ca_square_4_7":{"file":"https://ww2.kqed.org/app/uploads/sites/10/2020/03/RS14516_475371681-qut-550x550.jpg","width":550,"height":550,"mimeType":"image/jpeg"},"apple_news_ca_square_4_0":{"file":"https://ww2.kqed.org/app/uploads/sites/10/2020/03/RS14516_475371681-qut-470x470.jpg","width":470,"height":470,"mimeType":"image/jpeg"},"kqedFullSize":{"file":"https://ww2.kqed.org/app/uploads/sites/10/2020/03/RS14516_475371681-qut.jpg","width":1920,"height":1281}},"fetchFailed":false,"isLoading":false},"news_11780349":{"type":"attachments","id":"news_11780349","meta":{"index":"attachments_1591205162","site":"news","id":"11780349","found":true},"title":"RS39195__M6A0831-qut (1)","publishDate":1571191897,"status":"inherit","parent":11780213,"modified":1571257659,"caption":"Muslim teenagers attend a training to counter bullying at the Evergreen Islamic Center in San Jose on Sept. 13, 2019.","credit":"Sruti Mamidanna/KQED","description":null,"imgSizes":{"thumbnail":{"file":"https://ww2.kqed.org/app/uploads/sites/10/2019/10/RS39195__M6A0831-qut-1-160x102.jpg","width":160,"height":102,"mimeType":"image/jpeg"},"medium":{"file":"https://ww2.kqed.org/app/uploads/sites/10/2019/10/RS39195__M6A0831-qut-1-800x508.jpg","width":800,"height":508,"mimeType":"image/jpeg"},"large":{"file":"https://ww2.kqed.org/app/uploads/sites/10/2019/10/RS39195__M6A0831-qut-1-1020x648.jpg","width":1020,"height":648,"mimeType":"image/jpeg"},"complete_open_graph":{"file":"https://ww2.kqed.org/app/uploads/sites/10/2019/10/RS39195__M6A0831-qut-1-1200x763.jpg","width":1200,"height":763,"mimeType":"image/jpeg"},"post-thumbnail":{"file":"https://ww2.kqed.org/app/uploads/sites/10/2019/10/RS39195__M6A0831-qut-1-672x372.jpg","width":672,"height":372,"mimeType":"image/jpeg"},"twentyfourteen-full-width":{"file":"https://ww2.kqed.org/app/uploads/sites/10/2019/10/RS39195__M6A0831-qut-1-1038x576.jpg","width":1038,"height":576,"mimeType":"image/jpeg"},"full-width":{"file":"https://ww2.kqed.org/app/uploads/sites/10/2019/10/RS39195__M6A0831-qut-1-1920x1220.jpg","width":1920,"height":1220,"mimeType":"image/jpeg"},"apple_news_ca_landscape_12_9":{"file":"https://ww2.kqed.org/app/uploads/sites/10/2019/10/RS39195__M6A0831-qut-1-1832x1220.jpg","width":1832,"height":1220,"mimeType":"image/jpeg"},"apple_news_ca_landscape_9_7":{"file":"https://ww2.kqed.org/app/uploads/sites/10/2019/10/RS39195__M6A0831-qut-1-1376x1032.jpg","width":1376,"height":1032,"mimeType":"image/jpeg"},"apple_news_ca_landscape_5_5":{"file":"https://ww2.kqed.org/app/uploads/sites/10/2019/10/RS39195__M6A0831-qut-1-1044x783.jpg","width":1044,"height":783,"mimeType":"image/jpeg"},"apple_news_ca_landscape_4_7":{"file":"https://ww2.kqed.org/app/uploads/sites/10/2019/10/RS39195__M6A0831-qut-1-632x474.jpg","width":632,"height":474,"mimeType":"image/jpeg"},"apple_news_ca_landscape_4_0":{"file":"https://ww2.kqed.org/app/uploads/sites/10/2019/10/RS39195__M6A0831-qut-1-536x402.jpg","width":536,"height":402,"mimeType":"image/jpeg"},"apple_news_ca_portrait_12_9":{"file":"https://ww2.kqed.org/app/uploads/sites/10/2019/10/RS39195__M6A0831-qut-1-1122x1220.jpg","width":1122,"height":1220,"mimeType":"image/jpeg"},"apple_news_ca_portrait_9_7":{"file":"https://ww2.kqed.org/app/uploads/sites/10/2019/10/RS39195__M6A0831-qut-1-840x1120.jpg","width":840,"height":1120,"mimeType":"image/jpeg"},"apple_news_ca_portrait_5_5":{"file":"https://ww2.kqed.org/app/uploads/sites/10/2019/10/RS39195__M6A0831-qut-1-687x916.jpg","width":687,"height":916,"mimeType":"image/jpeg"},"apple_news_ca_portrait_4_7":{"file":"https://ww2.kqed.org/app/uploads/sites/10/2019/10/RS39195__M6A0831-qut-1-414x552.jpg","width":414,"height":552,"mimeType":"image/jpeg"},"apple_news_ca_portrait_4_0":{"file":"https://ww2.kqed.org/app/uploads/sites/10/2019/10/RS39195__M6A0831-qut-1-354x472.jpg","width":354,"height":472,"mimeType":"image/jpeg"},"apple_news_ca_square_12_9":{"file":"https://ww2.kqed.org/app/uploads/sites/10/2019/10/RS39195__M6A0831-qut-1-1472x1220.jpg","width":1472,"height":1220,"mimeType":"image/jpeg"},"apple_news_ca_square_9_7":{"file":"https://ww2.kqed.org/app/uploads/sites/10/2019/10/RS39195__M6A0831-qut-1-1104x1104.jpg","width":1104,"height":1104,"mimeType":"image/jpeg"},"apple_news_ca_square_5_5":{"file":"https://ww2.kqed.org/app/uploads/sites/10/2019/10/RS39195__M6A0831-qut-1-912x912.jpg","width":912,"height":912,"mimeType":"image/jpeg"},"apple_news_ca_square_4_7":{"file":"https://ww2.kqed.org/app/uploads/sites/10/2019/10/RS39195__M6A0831-qut-1-550x550.jpg","width":550,"height":550,"mimeType":"image/jpeg"},"apple_news_ca_square_4_0":{"file":"https://ww2.kqed.org/app/uploads/sites/10/2019/10/RS39195__M6A0831-qut-1-470x470.jpg","width":470,"height":470,"mimeType":"image/jpeg"},"kqedFullSize":{"file":"https://ww2.kqed.org/app/uploads/sites/10/2019/10/RS39195__M6A0831-qut-1.jpg","width":1920,"height":1220}},"fetchFailed":false,"isLoading":false}},"audioPlayerReducer":{"postId":"stream_live"},"authorsReducer":{"byline_news_11644927":{"type":"authors","id":"byline_news_11644927","meta":{"override":true},"slug":"byline_news_11644927","name":"\u003cstrong>Daniel Potter\u003c/strong>","isLoading":false},"jbrooks":{"type":"authors","id":"80","meta":{"index":"authors_1591205172","id":"80","found":true},"name":"Jon Brooks","firstName":"Jon","lastName":"Brooks","slug":"jbrooks","email":"jbrooks@kqed.org","display_author_email":true,"staff_mastheads":["science"],"title":"Digital Editor","bio":"Jon Brooks is a former Digital Editor for KQED Science. He is the former editor of KQED’s daily news blog, News Fix. In 2014, he won a California Journalism Award for his coverage of ride services like Uber and Lyft and the taxi industry. A veteran blogger, he previously worked for Yahoo! in various news writing and editing roles. Jon is also a playwright whose work has been produced in San Francisco, New York, Italy, and around the U.S. He has written about film for his own blog and studied film at Boston University.","avatar":"https://secure.gravatar.com/avatar/98887f7ed1c876ed414d4c915e969584?s=600&d=blank&r=g","twitter":"jbrooksfoy","facebook":null,"instagram":null,"linkedin":null,"sites":[{"site":"arts","roles":["Contributor","editor"]},{"site":"news","roles":["author"]},{"site":"futureofyou","roles":["administrator"]},{"site":"mindshift","roles":["editor"]},{"site":"stateofhealth","roles":["editor"]},{"site":"science","roles":["administrator"]},{"site":"quest","roles":["editor"]}],"headData":{"title":"Jon Brooks | KQED","description":"Digital Editor","ogImgSrc":"https://secure.gravatar.com/avatar/98887f7ed1c876ed414d4c915e969584?s=600&d=blank&r=g","twImgSrc":"https://secure.gravatar.com/avatar/98887f7ed1c876ed414d4c915e969584?s=600&d=blank&r=g"},"isLoading":false,"link":"/author/jbrooks"},"tychehendricks":{"type":"authors","id":"259","meta":{"index":"authors_1591205172","id":"259","found":true},"name":"Tyche Hendricks","firstName":"Tyche","lastName":"Hendricks","slug":"tychehendricks","email":"thendricks@kqed.org","display_author_email":true,"staff_mastheads":["news"],"title":"KQED Senior Editor, Immigration","bio":"\u003cspan style=\"font-weight: 400;\">Tyche Hendricks is KQED’s senior editor for immigration, leading coverage of the policy and politics that affect California’s immigrant communities. Her work for KQED’s radio and online audiences is also carried on NPR and other national outlets. She has been recognized with awards from the Radio and Television News Directors Association, the Society for Professional Journalists; the Education Writers Association; the Best of the West and the National Federation of Community Broadcasters. Before joining KQED in 2010, Tyche spent more than a dozen years as a newspaper reporter, notably at the \u003c/span>\u003ci>\u003cspan style=\"font-weight: 400;\">San Francisco Chronicle\u003c/span>\u003c/i>\u003cspan style=\"font-weight: 400;\">. At different times she has covered criminal justice, government and politics and urban planning. Tyche has taught in the MFA Creative Writing program at the University of San Francisco and at UC Berkeley’s Graduate School of Journalism, where she was co-director of a national immigration symposium for professional journalists. She is the author of \u003c/span>\u003ci>\u003cspan style=\"font-weight: 400;\">The Wind Doesn't Need a Passport: Stories from the U.S.-Mexico Borderlands\u003c/span>\u003c/i>\u003cspan style=\"font-weight: 400;\"> (University of California Press). \u003c/span>","avatar":"https://secure.gravatar.com/avatar/b8ee458e2731c2d43df86882ce17267e?s=600&d=blank&r=g","twitter":"tychehendricks","facebook":null,"instagram":null,"linkedin":null,"sites":[{"site":"news","roles":["editor"]},{"site":"stateofhealth","roles":["editor"]}],"headData":{"title":"Tyche Hendricks | KQED","description":"KQED Senior Editor, Immigration","ogImgSrc":"https://secure.gravatar.com/avatar/b8ee458e2731c2d43df86882ce17267e?s=600&d=blank&r=g","twImgSrc":"https://secure.gravatar.com/avatar/b8ee458e2731c2d43df86882ce17267e?s=600&d=blank&r=g"},"isLoading":false,"link":"/author/tychehendricks"},"adembosky":{"type":"authors","id":"3205","meta":{"index":"authors_1591205172","id":"3205","found":true},"name":"April Dembosky","firstName":"April","lastName":"Dembosky","slug":"adembosky","email":"adembosky@kqed.org","display_author_email":false,"staff_mastheads":["news","science"],"title":"KQED Health Correspondent","bio":"April Dembosky is the health correspondent for KQED News and a regular contributor to NPR. She specializes in covering altered states of mind, from postpartum depression to methamphetamine-induced psychosis to the insanity defense. Her investigative series on insurance companies sidestepping mental health laws won multiple awards, including first place in beat reporting from the national Association of Health Care Journalists. She is the recipient of numerous other prizes and fellowships, including a national Edward R. Murrow award for investigative reporting, a Society of Professional Journalists award for long-form storytelling, and a Carter Center Fellowship for Mental Health Journalism.\r\n\r\nDembosky reported and produced \u003cem>Soundtrack of Silence\u003c/em>, an audio documentary about music and memory that is currently being made into a feature film by Paramount Pictures.\r\n\r\nBefore joining KQED in 2013, Dembosky covered technology and Silicon Valley for \u003cem>The Financial Times of London,\u003c/em> and contributed business and arts stories to \u003cem>Marketplace \u003c/em>and \u003cem>The New York Times.\u003c/em> She got her undergraduate degree in philosophy from Smith College and her master's in journalism from the University of California, Berkeley. She is a classically trained violinist and proud alum of the first symphony orchestra at Burning Man.","avatar":"https://secure.gravatar.com/avatar/ef92999be4ceb9ea60701e7dc276f813?s=600&d=blank&r=g","twitter":"adembosky","facebook":null,"instagram":null,"linkedin":null,"sites":[{"site":"arts","roles":["author"]},{"site":"news","roles":["editor"]},{"site":"futureofyou","roles":["author"]},{"site":"stateofhealth","roles":["editor"]},{"site":"science","roles":["editor"]},{"site":"forum","roles":["editor"]}],"headData":{"title":"April Dembosky | KQED","description":"KQED Health Correspondent","ogImgSrc":"https://secure.gravatar.com/avatar/ef92999be4ceb9ea60701e7dc276f813?s=600&d=blank&r=g","twImgSrc":"https://secure.gravatar.com/avatar/ef92999be4ceb9ea60701e7dc276f813?s=600&d=blank&r=g"},"isLoading":false,"link":"/author/adembosky"},"fjhabvala":{"type":"authors","id":"8659","meta":{"index":"authors_1591205172","id":"8659","found":true},"name":"Farida Jhabvala Romero","firstName":"Farida","lastName":"Jhabvala Romero","slug":"fjhabvala","email":"fjhabvala@kqed.org","display_author_email":true,"staff_mastheads":["news"],"title":"KQED Contributor","bio":"\u003cspan style=\"font-weight: 400;\">Farida Jhabvala Romero is a Labor Correspondent for KQED. She previously covered immigration. Farida was \u003ca href=\"https://www.ccnma.org/2022-most-influential-latina-journalists\">named\u003c/a> one of the 10 Most Influential Latina Journalists in California in 2022 by the California Chicano News Media Association. Her work has won awards from the Society of Professional Journalists (Northern California), as well as a national and regional Edward M. Murrow Award for the collaborative reporting projects “Dangerous Air” and “Graying California.” \u003c/span>\u003cspan style=\"font-weight: 400;\">Before joining KQED, Farida worked as a producer at Radio Bilingüe, a national public radio network. Farida earned her master’s degree in journalism from Stanford University.\u003c/span>","avatar":"https://secure.gravatar.com/avatar/c3ab27c5554b67b478f80971e515aa02?s=600&d=blank&r=g","twitter":"FaridaJhabvala","facebook":null,"instagram":null,"linkedin":"https://www.linkedin.com/in/faridajhabvala/","sites":[{"site":"news","roles":["editor"]},{"site":"stateofhealth","roles":["author"]}],"headData":{"title":"Farida Jhabvala Romero | KQED","description":"KQED Contributor","ogImgSrc":"https://secure.gravatar.com/avatar/c3ab27c5554b67b478f80971e515aa02?s=600&d=blank&r=g","twImgSrc":"https://secure.gravatar.com/avatar/c3ab27c5554b67b478f80971e515aa02?s=600&d=blank&r=g"},"isLoading":false,"link":"/author/fjhabvala"},"korr":{"type":"authors","id":"11200","meta":{"index":"authors_1591205172","id":"11200","found":true},"name":"Katie Orr","firstName":"Katie","lastName":"Orr","slug":"korr","email":"korr@kqed.org","display_author_email":false,"staff_mastheads":[],"title":"KQED Contributor","bio":"Katie Orr was a Sacramento-based reporter for KQED's Politics and Government Desk, covering the state Capitol and a variety of issues including women in politics, voting and elections and legislation. Prior to joining KQED in 2016, Katie was state government reporter for Capital Public Radio in Sacramento. She's also worked for KPBS in San Diego, where she covered City Hall.\r\n\r\nKatie received her masters degree in political science from San Diego State University and holds a Bachelors degree in broadcast journalism from Arizona State University.\r\n\r\nIn 2015 Katie won a national Clarion Award for a series of stories she did on women in California politics. She's been honored by the Society for Professional Journalists and, in 2013, was named by \u003cem>The Washington Post\u003c/em> as one of the country's top state Capitol reporters. She's also reported for the award-winning documentary series \u003cem>The View from Here \u003c/em>and was part of the team that won national PRNDI and Gabriel Awards in 2015. She lives in Sacramento with her husband. Twitter: @1KatieOrr","avatar":"https://secure.gravatar.com/avatar/41a40b25845adc78f50808670860449e?s=600&d=blank&r=g","twitter":"1katieorr","facebook":null,"instagram":null,"linkedin":null,"sites":[{"site":"news","roles":["subscriber"]},{"site":"stateofhealth","roles":["author"]},{"site":"forum","roles":["author"]}],"headData":{"title":"Katie Orr | KQED","description":"KQED Contributor","ogImgSrc":"https://secure.gravatar.com/avatar/41a40b25845adc78f50808670860449e?s=600&d=blank&r=g","twImgSrc":"https://secure.gravatar.com/avatar/41a40b25845adc78f50808670860449e?s=600&d=blank&r=g"},"isLoading":false,"link":"/author/korr"}},"breakingNewsReducer":{},"campaignFinanceReducer":{},"firebase":{"requesting":{},"requested":{},"timestamps":{},"data":{},"ordered":{},"auth":{"isLoaded":false,"isEmpty":true},"authError":null,"profile":{"isLoaded":false,"isEmpty":true},"listeners":{"byId":{},"allIds":[]},"isInitializing":false,"errors":[]},"navBarReducer":{"navBarId":"news","fullView":true,"showPlayer":false},"navMenuReducer":{"menus":[{"key":"menu1","items":[{"name":"News","link":"/","type":"title"},{"name":"Politics","link":"/politics"},{"name":"Science","link":"/science"},{"name":"Education","link":"/educationnews"},{"name":"Housing","link":"/housing"},{"name":"Immigration","link":"/immigration"},{"name":"Criminal Justice","link":"/criminaljustice"},{"name":"Silicon Valley","link":"/siliconvalley"},{"name":"Forum","link":"/forum"},{"name":"The California Report","link":"/californiareport"}]},{"key":"menu2","items":[{"name":"Arts & Culture","link":"/arts","type":"title"},{"name":"Critics’ Picks","link":"/thedolist"},{"name":"Cultural Commentary","link":"/artscommentary"},{"name":"Food & Drink","link":"/food"},{"name":"Bay Area Hip-Hop","link":"/bayareahiphop"},{"name":"Rebel Girls","link":"/rebelgirls"},{"name":"Arts Video","link":"/artsvideos"}]},{"key":"menu3","items":[{"name":"Podcasts","link":"/podcasts","type":"title"},{"name":"Bay Curious","link":"/podcasts/baycurious"},{"name":"Rightnowish","link":"/podcasts/rightnowish"},{"name":"The Bay","link":"/podcasts/thebay"},{"name":"On Our Watch","link":"/podcasts/onourwatch"},{"name":"Mindshift","link":"/podcasts/mindshift"},{"name":"Consider This","link":"/podcasts/considerthis"},{"name":"Political Breakdown","link":"/podcasts/politicalbreakdown"}]},{"key":"menu4","items":[{"name":"Live Radio","link":"/radio","type":"title"},{"name":"TV","link":"/tv","type":"title"},{"name":"Events","link":"/events","type":"title"},{"name":"For Educators","link":"/education","type":"title"},{"name":"Support KQED","link":"/support","type":"title"},{"name":"About","link":"/about","type":"title"},{"name":"Help Center","link":"https://kqed-helpcenter.kqed.org/s","type":"title"}]}]},"pagesReducer":{},"postsReducer":{"stream_live":{"type":"live","id":"stream_live","audioUrl":"https://streams.kqed.org/kqedradio","title":"Live Stream","excerpt":"Live Stream information currently unavailable.","link":"/radio","featImg":"","label":{"name":"KQED Live","link":"/"}},"stream_kqedNewscast":{"type":"posts","id":"stream_kqedNewscast","audioUrl":"https://www.kqed.org/.stream/anon/radio/RDnews/newscast.mp3?_=1","title":"KQED Newscast","featImg":"","label":{"name":"88.5 FM","link":"/"}},"news_11644927":{"type":"posts","id":"news_11644927","meta":{"index":"posts_1591205157","site":"news","id":"11644927","score":null,"sort":[1712829645000]},"guestAuthors":[],"slug":"eucalyptus-how-californias-most-hated-tree-took-root-2","title":"Eucalyptus: How California's Most Hated Tree Took Root","publishDate":1712829645,"format":"audio","headTitle":"Eucalyptus: How California’s Most Hated Tree Took Root | KQED","labelTerm":{},"content":"\u003cp>\u003ca href=\"#episode-transcript\">\u003ci>View the full episode transcript.\u003c/i>\u003c/a> \u003cem>This article was first published in February 1, 2018, and was updated on April 11, 2024. \u003c/em>\u003c/p>\n\u003cp>Depending on whom you ask, eucalyptus trees are either an icon in California or a fire-prone scourge.\u003c/p>\n\u003cp>Bay Curious heard from two hikers wanting to know about the past and future of California’s eucalyptus trees.\u003c/p>\n\u003cp>[baycuriouspodcastinfo]\u003c/p>\n\u003cp>“How did all of this eucalyptus get to the Bay Area?” asked Christian Wagner, a tech worker who lives in Pleasanton.\u003c/p>\n\u003cp>[ad fullwidth]\u003c/p>\n\u003cp>“I know that they’re invasive, so what do we do about that? Are they worth keeping around? Or do we need to get rid of them and replace them with something else?” wondered Julie Bergen, an occupational therapist from Alameda.\u003c/p>\n\u003cp>Reaching heights of more than 100 feet, the main kind of eucalyptus you’re likely to see here is Tasmanian blue gum, eucalyptus globulus. They feature sickle-shaped leaves hanging from high branches, and deciduous bark that is forever peeling from their shaggy trunks. Some people experience the smell of eucalyptus as medicinal; others say the trees just smell like California.\u003c/p>\n\u003cfigure id=\"attachment_11647124\" class=\"wp-caption aligncenter\" style=\"max-width: 800px\">\u003cimg loading=\"lazy\" decoding=\"async\" class=\"wp-image-11647124 size-medium\" src=\"https://ww2.kqed.org/news/wp-content/uploads/sites/10/2018/01/RS29068_eucalyptusgrove7-800x533.jpg\" alt=\"The trees are deciduous, shedding their bark every year.\" width=\"800\" height=\"533\" srcset=\"https://cdn.kqed.org/wp-content/uploads/sites/10/2018/01/RS29068_eucalyptusgrove7-800x533.jpg 800w, https://cdn.kqed.org/wp-content/uploads/sites/10/2018/01/RS29068_eucalyptusgrove7-160x107.jpg 160w, https://cdn.kqed.org/wp-content/uploads/sites/10/2018/01/RS29068_eucalyptusgrove7-1020x680.jpg 1020w, https://cdn.kqed.org/wp-content/uploads/sites/10/2018/01/RS29068_eucalyptusgrove7-1920x1280.jpg 1920w, https://cdn.kqed.org/wp-content/uploads/sites/10/2018/01/RS29068_eucalyptusgrove7-1180x787.jpg 1180w, https://cdn.kqed.org/wp-content/uploads/sites/10/2018/01/RS29068_eucalyptusgrove7-960x640.jpg 960w, https://cdn.kqed.org/wp-content/uploads/sites/10/2018/01/RS29068_eucalyptusgrove7-240x160.jpg 240w, https://cdn.kqed.org/wp-content/uploads/sites/10/2018/01/RS29068_eucalyptusgrove7-375x250.jpg 375w, https://cdn.kqed.org/wp-content/uploads/sites/10/2018/01/RS29068_eucalyptusgrove7-520x347.jpg 520w\" sizes=\"(max-width: 800px) 100vw, 800px\">\u003cfigcaption class=\"wp-caption-text\">The trees are deciduous, shedding their bark every year. \u003ccite>(Samantha Shanahan/KQED)\u003c/cite>\u003c/figcaption>\u003c/figure>\n\u003ch2>So how did eucalyptus trees get here?\u003c/h2>\n\u003cp>“They came here as envelopes of seeds on boats coming to California in the 1850s,” explains Jared Farmer, author of \u003ca href=\"https://jaredfarmer.net/books/trees-in-paradise/\">“Trees In Paradise: A California History.”\u003c/a>\u003c/p>\n\u003cp>During the Gold Rush, Australians were among the throngs flocking to a place where wood was in short supply.\u003c/p>\n\u003cp>“This was the era of wood power,” Farmer says. “Wood was used for almost everything. For energy, of course, but also for building every city, for moving things around, all the things where today we use concrete and plastic and steel.”\u003c/p>\n\u003cp>Besides the practical need to plant more trees, settlers who were used to dense forests also felt that the lack of trees in California’s grassy, marshy, scrubby landscape made it feel incomplete. So within a few years, nurseries in San Francisco were selling young eucalyptus grown from seed.\u003c/p>\n\u003cp>The trees grew remarkably quickly here, even in poor soil.\u003c/p>\n\u003cp>“In an average rainfall year here in California, these trees probably put on 4 to 6 feet in height and maybe, in their early growth years, a half-inch to an inch in diameter,” says Joe McBride, a UC Berkeley professor emeritus of landscape architecture and environmental planning.\u003c/p>\n\u003cp>Beyond the drive to change the landscape and provide firewood, Californians also planted eucalyptus (mainly blue gum) to serve as windbreaks.\u003c/p>\n\u003cfigure id=\"attachment_11647125\" class=\"wp-caption aligncenter\" style=\"max-width: 800px\">\u003cimg loading=\"lazy\" decoding=\"async\" class=\"wp-image-11647125 size-medium\" src=\"https://ww2.kqed.org/news/wp-content/uploads/sites/10/2018/01/RS29071_eucalyptusgrove10-800x533.jpg\" alt=\"Eucalyptus trees grow fast, sometimes putting on four to six feet in height in a single year.\" width=\"800\" height=\"533\" srcset=\"https://cdn.kqed.org/wp-content/uploads/sites/10/2018/01/RS29071_eucalyptusgrove10-800x533.jpg 800w, https://cdn.kqed.org/wp-content/uploads/sites/10/2018/01/RS29071_eucalyptusgrove10-160x107.jpg 160w, https://cdn.kqed.org/wp-content/uploads/sites/10/2018/01/RS29071_eucalyptusgrove10-1020x680.jpg 1020w, https://cdn.kqed.org/wp-content/uploads/sites/10/2018/01/RS29071_eucalyptusgrove10-1920x1280.jpg 1920w, https://cdn.kqed.org/wp-content/uploads/sites/10/2018/01/RS29071_eucalyptusgrove10-1180x787.jpg 1180w, https://cdn.kqed.org/wp-content/uploads/sites/10/2018/01/RS29071_eucalyptusgrove10-960x640.jpg 960w, https://cdn.kqed.org/wp-content/uploads/sites/10/2018/01/RS29071_eucalyptusgrove10-240x160.jpg 240w, https://cdn.kqed.org/wp-content/uploads/sites/10/2018/01/RS29071_eucalyptusgrove10-375x250.jpg 375w, https://cdn.kqed.org/wp-content/uploads/sites/10/2018/01/RS29071_eucalyptusgrove10-520x347.jpg 520w\" sizes=\"(max-width: 800px) 100vw, 800px\">\u003cfigcaption class=\"wp-caption-text\">Eucalyptus trees grow fast, sometimes putting on 4 to 6 feet in height in a single year. \u003ccite>(Samantha Shanahan/KQED)\u003c/cite>\u003c/figcaption>\u003c/figure>\n\u003cp>In fact, that was the original purpose of what’s now the largest, densest stand of blue gum eucalyptus in the world, on campus at Berkeley, says McBride. It was planted around 140 years ago to provide a windbreak for an old cinder running track — to keep its fine ashen gravel from blowing into athletes’ faces.\u003c/p>\n\u003cp>The trees’ success in California owed to a lack of enemies here. Because they were grown from seed, they hadn’t brought along any of the pests or pathogens they contend with back in Australia.\u003c/p>\n\u003ch2>An early 20th century boom\u003c/h2>\n\u003cp>Within a few decades of its arrival, many Californians grew disenchanted with eucalyptus. Blue gum proved terrible for woodworking — the wood often split and cracked, making it a poor choice for railroad ties. The trees also proved thirsty enough to drain nearby wells.\u003c/p>\n\u003cp>“If you go back to California farm journals of the 1870s, ’80s, ’90s, there’s just report after report of disappointment, like ‘these trees are no good,’ ” says Farmer, the historian.\u003c/p>\n\u003cp>But things changed in the early 20th century when U.S. Forest Service officials grew concerned about a looming timber famine. They feared forests in the eastern United States had been overexploited and wouldn’t grow back, and predicted the supply of hardwood would dwindle over the next 15 years.\u003c/p>\n\u003cfigure id=\"attachment_11647127\" class=\"wp-caption aligncenter\" style=\"max-width: 800px\">\u003cimg loading=\"lazy\" decoding=\"async\" class=\"wp-image-11647127 size-medium\" src=\"https://ww2.kqed.org/news/wp-content/uploads/sites/10/2018/01/RS29072_eucalyptusgrove11-800x533.jpg\" alt=\"The bark sheds often, peeling in large strips.\" width=\"800\" height=\"533\" srcset=\"https://cdn.kqed.org/wp-content/uploads/sites/10/2018/01/RS29072_eucalyptusgrove11-800x533.jpg 800w, https://cdn.kqed.org/wp-content/uploads/sites/10/2018/01/RS29072_eucalyptusgrove11-160x107.jpg 160w, https://cdn.kqed.org/wp-content/uploads/sites/10/2018/01/RS29072_eucalyptusgrove11-1020x680.jpg 1020w, https://cdn.kqed.org/wp-content/uploads/sites/10/2018/01/RS29072_eucalyptusgrove11-1920x1280.jpg 1920w, https://cdn.kqed.org/wp-content/uploads/sites/10/2018/01/RS29072_eucalyptusgrove11-1180x787.jpg 1180w, https://cdn.kqed.org/wp-content/uploads/sites/10/2018/01/RS29072_eucalyptusgrove11-960x640.jpg 960w, https://cdn.kqed.org/wp-content/uploads/sites/10/2018/01/RS29072_eucalyptusgrove11-240x160.jpg 240w, https://cdn.kqed.org/wp-content/uploads/sites/10/2018/01/RS29072_eucalyptusgrove11-375x250.jpg 375w, https://cdn.kqed.org/wp-content/uploads/sites/10/2018/01/RS29072_eucalyptusgrove11-520x347.jpg 520w\" sizes=\"(max-width: 800px) 100vw, 800px\">\u003cfigcaption class=\"wp-caption-text\">The bark sheds often, peeling in large strips. \u003ccite>(Samantha Shanahan/KQED)\u003c/cite>\u003c/figcaption>\u003c/figure>\n\u003cp>Investors saw an opportunity: California had a tree capable of growing to full size within that time frame. If hardwood was about to be scarce, they reasoned, such trees could be in high demand and yield sizable returns within a few short years.\u003c/p>\n\u003cp>These people, Farmer says, were not reading blue gum’s lousy reviews in old farm reports. “And even if they did read them, maybe they wouldn’t care because they just wanted to make a buck; they were just flipping land.”\u003c/p>\n\u003cp>This played out as a speculative frenzy — a bubble. Boosters began selling plantations dense with eucalyptus — hundreds of trees per acre. Farmer writes in his book that claims were made like: “Forests Grown While You Wait,” and “Absolute Security and Absolute Certainty.” In just a few years, millions of blue gums were planted from Southern California up to Mendocino.\u003c/p>\n\u003cp>The anticipated timber famine never came to pass. Forests further east proved more resilient than expected, and the need was offset by concrete, steel and imports, like mahogany. Ultimately, the thousands of acres of eucalyptus planted around California were not even worth cutting down. Much of what you see today is a century-old abandoned crop.\u003c/p>\n\u003ch2>What’s fire got to do with it?\u003c/h2>\n\u003cp>Eucalyptus trees have lovers and haters in California. A big part of the debate over whether the trees should be allowed to persist here traces back to the East Bay firestorm of 1991, which left 25 people dead and thousands homeless. Vast swaths of eucalyptus burned.\u003c/p>\n\u003cp>“People at the time, I don’t think, associated that with a planted plantation; it was just a eucalyptus forest,” says CalPoly botanist Jenn Yost. “And then when the fire came through — I mean that fire came through so fast and so hot and so many people lost their homes that it was a natural reaction to hate blue gums at that point.”\u003c/p>\n\u003cp>Many experts say that eucalyptus trees worsen the fire threat for a few reasons.\u003c/p>\n\u003cul>\n\u003cli>The bark they shed dries out quickly and creates fuel.\u003c/li>\n\u003cli>Once a fire starts, that bark easily catches the wind and can be blown miles away, spreading the fire quickly.\u003c/li>\n\u003cli>Eucalyptus trees are really oily. The oil is actually what gives off that intense fragrance they’re known for. But in a fire, that oil also makes them flammable.\u003c/li>\n\u003c/ul>\n\u003cp>But Eucalyptus trees have supporters too, who argue other plants in their place would also burn. A few years ago, federal funding to cut down trees in the East Bay hills was \u003ca href=\"http://www.berkeleyside.com/2016/09/19/fema-pulls-funding-for-tree-clearing-in-berkeley-hills/\" target=\"_blank\" rel=\"noopener\">rescinded\u003c/a>, after \u003ca href=\"http://www.berkeleyside.com/2015/07/18/in-berkeley-protesters-strip-naked-to-try-to-save-trees/\" target=\"_blank\" rel=\"noopener\">protesters\u003c/a> got naked and hugged the eucalyptus trees on campus at Cal. \u003cspan style=\"font-weight: 400;\">But after a nearly decade-long legal battle, a court gave UC Berkeley the go-ahead to cut. Still, it’s a drop in the bucket when you think about how many of these trees we have in California.\u003c/span>\u003c/p>\n\u003cfigure id=\"attachment_11647123\" class=\"wp-caption alignright\" style=\"max-width: 640px\">\u003cimg loading=\"lazy\" decoding=\"async\" class=\"size-large wp-image-11647123\" src=\"https://ww2.kqed.org/news/wp-content/uploads/sites/10/2018/01/RS29066_eucalyptusgrove2-1020x1530.jpg\" alt=\"To some, the scent of eucalyptus trees is simply the scent of California.\" width=\"640\" height=\"960\" srcset=\"https://cdn.kqed.org/wp-content/uploads/sites/10/2018/01/RS29066_eucalyptusgrove2-1020x1530.jpg 1020w, https://cdn.kqed.org/wp-content/uploads/sites/10/2018/01/RS29066_eucalyptusgrove2-160x240.jpg 160w, https://cdn.kqed.org/wp-content/uploads/sites/10/2018/01/RS29066_eucalyptusgrove2-800x1200.jpg 800w, https://cdn.kqed.org/wp-content/uploads/sites/10/2018/01/RS29066_eucalyptusgrove2-1920x2880.jpg 1920w, https://cdn.kqed.org/wp-content/uploads/sites/10/2018/01/RS29066_eucalyptusgrove2-1180x1770.jpg 1180w, https://cdn.kqed.org/wp-content/uploads/sites/10/2018/01/RS29066_eucalyptusgrove2-960x1440.jpg 960w, https://cdn.kqed.org/wp-content/uploads/sites/10/2018/01/RS29066_eucalyptusgrove2-240x360.jpg 240w, https://cdn.kqed.org/wp-content/uploads/sites/10/2018/01/RS29066_eucalyptusgrove2-375x563.jpg 375w, https://cdn.kqed.org/wp-content/uploads/sites/10/2018/01/RS29066_eucalyptusgrove2-520x780.jpg 520w\" sizes=\"(max-width: 640px) 100vw, 640px\">\u003cfigcaption class=\"wp-caption-text\">To some, the scent of eucalyptus trees is simply the scent of California. \u003ccite>(Samantha Shanahan/KQED)\u003c/cite>\u003c/figcaption>\u003c/figure>\n\u003ch2>Are they here to stay?\u003c/h2>\n\u003cp>Blue gums can’t reproduce on their own just anywhere in California; Yost says they need year-round moisture. They’re able to regenerate in places like California’s coastal fog belt, but elsewhere “there are some plantations that don’t reproduce at all. When you go there, the trees are all in their rows, there’s few saplings anywhere to be seen, and those trees are just getting older.”\u003c/p>\n\u003cp>Not all non-native plants capable of reproducing on their own do it enough to have an ecological impact, Yost says.\u003c/p>\n\u003cp>“As soon as it starts outcompeting native species or fundamentally changing the environment so that native species can’t grow there, we would consider that an invasive species,” she says.\u003c/p>\n\u003cp>Blue gum is \u003ca href=\"http://www.cal-ipc.org/wp-content/uploads/2017/03/Cal-IPC_News_Summer2014-6.pdf#page=10\" target=\"_blank\" rel=\"noopener\">classified\u003c/a> as a “moderate” invasive, putting it a \u003ca href=\"http://www.cal-ipc.org/plants/inventory/\" target=\"_blank\" rel=\"noopener\">tier\u003c/a> below such uncharismatic weeds as yellow star-thistle and medusahead. McBride, the retired Berkeley professor, says “although there’s been marginal expansion of some eucalyptus stands, it’s really not well adapted for long-distance dispersal. It hasn’t really spread very much on its own.”\u003c/p>\n\u003cp>[baycuriousbug]\u003c/p>\n\u003cp>With an estimated 40,000 acres of unharvested eucalyptus planted across the state, the trees aren’t easy to get rid of. Slicing down a large blue gum near a building can require a crane, at an expense of thousands of dollars. And keeping them from resprouting can also be its own chore.\u003c/p>\n\u003cp>Long term, as the climate changes over the coming decades, it’s possible the aging eucalyptus groves that don’t get enough water to reproduce will begin to die.\u003c/p>\n\u003cp>Then again, if the state becomes \u003ca href=\"https://ww2.kqed.org/science/2015/02/12/new-study-global-warming-will-bring-megadroughts-to-the-west/\" target=\"_blank\" rel=\"noopener\">hotter and drier\u003c/a>, it may become the type of place where some Australian species are able to thrive.\u003c/p>\n\u003cp>[baycuriousquestion]\u003c/p>\n\u003ch2 id=\"episode-transcript\">Episode Transcript\u003c/h2>\n\u003cp>\u003cb>Olivia Allen-Price: \u003c/b>\u003cspan style=\"font-weight: 400;\">Do you see any koala bears?\u003c/span>\u003c/p>\n\u003cp>\u003cb>Daniel Potter:\u003c/b>\u003cspan style=\"font-weight: 400;\"> I wish.\u003c/span>\u003c/p>\n\u003cp>\u003cb>\u003ci>[sound of bark crunching underfoot]\u003c/i>\u003c/b>\u003c/p>\n\u003cp>\u003cb>Daniel Potter:\u003c/b>\u003cspan style=\"font-weight: 400;\"> Should we tell people where we are?\u003c/span>\u003c/p>\n\u003cp>\u003cb>Olivia Allen-Price: \u003c/b>\u003cspan style=\"font-weight: 400;\">Yeah, so we are at the Mount Sutro Open Space Reserve. Which has gotta be pretty close to the geographic center of San Francisco, would you imagine, right?\u003c/span>\u003c/p>\n\u003cp>\u003cb>Daniel Potter: \u003c/b>\u003cspan style=\"font-weight: 400;\">I think that’s fair. And we are surrounded by a ton of what look to be ancient eucalyptus trees.\u003c/span>\u003c/p>\n\u003cp>\u003cb>Olivia Allen-Price:\u003c/b>\u003cspan style=\"font-weight: 400;\"> If you’re not familiar with eucalyptus trees, they’re very tall. How tall would you say those are?\u003c/span>\u003c/p>\n\u003cp>\u003cb>Daniel Potter: \u003c/b>\u003cspan style=\"font-weight: 400;\">We’ve seen some today over a hundred feet, for sure.\u003c/span>\u003c/p>\n\u003cp>\u003cb>Olivia Allen-Price:\u003c/b>\u003cspan style=\"font-weight: 400;\"> Definitely. And they have this weird bark, where the underpart of the tree is really smooth but their bark on the outside flakes off.\u003c/span>\u003c/p>\n\u003cp>\u003cb>Daniel Potter:\u003c/b>\u003cspan style=\"font-weight: 400;\"> It’s deciduous, but it leaves this tan, almost naked-looking trunk behind.\u003c/span>\u003c/p>\n\u003cp>\u003cb>Olivia Allen-Price:\u003c/b>\u003cspan style=\"font-weight: 400;\"> And these would not be good climbing trees.\u003c/span>\u003c/p>\n\u003cp>\u003cb>Daniel Potter:\u003c/b>\u003cspan style=\"font-weight: 400;\"> Yeah, most of the branches, like, what’s the lowest branch on that one? It’s like 30 feet up, how are you gonna climb that?\u003c/span>\u003c/p>\n\u003cp>\u003cb>Olivia Allen-Price: \u003c/b>\u003cspan style=\"font-weight: 400;\">One thing I think a lot of people remark about eucalyptus trees in the smell.\u003c/span>\u003c/p>\n\u003cp>\u003cb>\u003ci>(inhale, exhale)\u003c/i>\u003c/b>\u003c/p>\n\u003cp>\u003cb>Daniel Potter: \u003c/b>\u003cspan style=\"font-weight: 400;\">Some people hate it. But a couple people I talked to for this story—they say these trees just smell like California.\u003c/span>\u003c/p>\n\u003cp>\u003cb>Olivia Allen-Price: \u003c/b>\u003cspan style=\"font-weight: 400;\">Which is pretty weird for a tree from Australia! \u003c/span>\u003c/p>\n\u003cp>\u003cb>\u003ci>Theme music\u003c/i>\u003c/b>\u003c/p>\n\u003cp>\u003cb>Olivia Allen-Price:\u003c/b>\u003cspan style=\"font-weight: 400;\"> I’m Olivia Allen-Price, and this is Bay Curious, where we answer your questions about the Bay Area. On this episode, science writer Daniel Potter and I take a closer look at Eucalyptus Trees.\u003c/span>\u003c/p>\n\u003cp>\u003cb>Daniel Potter: \u003c/b>\u003cspan style=\"font-weight: 400;\">They have lovers—and haters.\u003c/span>\u003c/p>\n\u003cp>\u003cb>Olivia Allen-Price: \u003c/b>\u003cspan style=\"font-weight: 400;\">And there are giant stands of them throughout our region. This story first ran in 2018, but your questions about eucalyptus trees have kept on coming! So we thought it was time to freshen up this episode with some new information. We’ll get to it right after this.\u003c/span>\u003c/p>\n\u003cp>\u003cb>\u003ci>Sponsor Message\u003c/i>\u003c/b>\u003c/p>\n\u003cp>\u003cb>Olivia Allen-Price: \u003c/b>\u003cspan style=\"font-weight: 400;\">Alright! Let’s get to this week’s question, shall we? Or should I say \u003c/span>\u003ci>\u003cspan style=\"font-weight: 400;\">QUESTIONS\u003c/span>\u003c/i>\u003cspan style=\"font-weight: 400;\"> because we heard from two different listeners on this one…\u003c/span>\u003c/p>\n\u003cp>\u003cb>Christian Wagner:\u003c/b>\u003cspan style=\"font-weight: 400;\"> How did all of this eucalyptus get to the Bay Area?\u003c/span>\u003c/p>\n\u003cp>\u003cb>Olivia Allen-Price: \u003c/b>\u003cspan style=\"font-weight: 400;\">That’s Christian Wagner. He’s noticed lots of eucalyptus trees as he’s out and about because he likes hiking.\u003c/span>\u003cspan style=\"font-weight: 400;\">\u003cbr>\n\u003c/span>\u003cspan style=\"font-weight: 400;\">\u003cbr>\n\u003c/span>\u003cb>Daniel Potter:\u003c/b>\u003cspan style=\"font-weight: 400;\"> –as does Julie Bergen.\u003c/span>\u003c/p>\n\u003cp>\u003cb>Julie Bergen:\u003c/b> \u003cspan style=\"font-weight: 400;\">And I know that they’re invasive, so what do we do about that? Are they worth keeping around? Or do we need to get rid of them and replace them with something else?\u003c/span>\u003c/p>\n\u003cp>\u003cb>Olivia Allen-Price:\u003c/b>\u003cspan style=\"font-weight: 400;\"> Christian and Julie both wonder about eucalyptus’ past—and its future here. Some people argue the trees are bad for \u003c/span>\u003ci>\u003cspan style=\"font-weight: 400;\">native\u003c/span>\u003c/i>\u003cspan style=\"font-weight: 400;\"> plant life—and a fire hazard—and need to go. So. Science writer Daniel Potter!\u003c/span>\u003c/p>\n\u003cp>\u003cb>Daniel Potter:\u003c/b>\u003cspan style=\"font-weight: 400;\"> Howdy.\u003c/span>\u003cspan style=\"font-weight: 400;\">\u003cbr>\n\u003c/span>\u003cspan style=\"font-weight: 400;\">\u003cbr>\n\u003c/span>\u003cb>Olivia Allen-Price: \u003c/b>\u003cspan style=\"font-weight: 400;\">Where do we begin unraveling this one?\u003c/span>\u003cspan style=\"font-weight: 400;\">\u003cbr>\n\u003c/span>\u003cspan style=\"font-weight: 400;\">\u003cbr>\n\u003c/span>\u003cb>Daniel Potter:\u003c/b>\u003cspan style=\"font-weight: 400;\"> In a forest. \u003c/span>\u003c/p>\n\u003cp>\u003cb>\u003ci>Albany Hill outdoor ambi\u003c/i>\u003c/b>\u003c/p>\n\u003cp>\u003cb>Daniel Potter:\u003c/b>\u003cspan style=\"font-weight: 400;\"> Let’s start with one on Albany Hill in the East Bay. You can see it from I-80, near the racetrack. That’s where I talked to this guy…\u003c/span>\u003c/p>\n\u003cp>\u003cb>Jared Farmer: \u003c/b>\u003cspan style=\"font-weight: 400;\">My name is Jared Farmer, I’m a professor of history at Stony Brook University, and the author of \u003c/span>\u003ci>\u003cspan style=\"font-weight: 400;\">Trees In Paradise: A California History\u003c/span>\u003c/i>\u003cspan style=\"font-weight: 400;\">.\u003c/span>\u003c/p>\n\u003cp>\u003cb>Daniel Potter: \u003c/b>\u003cspan style=\"font-weight: 400;\">That book includes a solid hundred pages on eucalyptus trees in California, so I asked Farmer how they got here:\u003c/span>\u003c/p>\n\u003cp>\u003cb>Jared Farmer: \u003c/b>\u003cspan style=\"font-weight: 400;\">They came here as envelopes of seeds on boats in the 1850s.\u003c/span>\u003c/p>\n\u003cp>\u003cb>Daniel Potter: \u003c/b>\u003cspan style=\"font-weight: 400;\">He says the Gold Rush drew people from all over—including from Australia. \u003c/span>\u003cspan style=\"font-weight: 400;\">\u003cbr>\n\u003c/span>\u003cspan style=\"font-weight: 400;\">\u003cbr>\n\u003c/span>\u003ci>\u003cspan style=\"font-weight: 400;\">Sea shanty music …“In South Australia I was born, heed away all the way”\u003c/span>\u003c/i>\u003cspan style=\"font-weight: 400;\">\u003cbr>\n\u003c/span>\u003cspan style=\"font-weight: 400;\">\u003cbr>\n\u003c/span>\u003cb>Daniel Potter: \u003c/b>\u003cspan style=\"font-weight: 400;\">And they were coming to a place where wood was in short supply. \u003c/span>\u003c/p>\n\u003cp>\u003cb>Jared Farmer: \u003c/b>\u003cspan style=\"font-weight: 400;\">What we think of today as like say native California, Indigenous California, or pre-contact California was far more woody than wooded. Actually it was far more land that was chaparral and savanna and wetland and marshland than timberland…\u003c/span>\u003c/p>\n\u003cp>\u003cb>Daniel Potter:\u003c/b>\u003cspan style=\"font-weight: 400;\"> People settling here wanted to plant trees. \u003c/span>\u003cspan style=\"font-weight: 400;\">\u003cbr>\n\u003c/span>\u003cspan style=\"font-weight: 400;\">\u003cbr>\n\u003c/span>\u003cb>Olivia Allen-Price: \u003c/b>\u003cspan style=\"font-weight: 400;\">If you’re used to trees, the California landscape might feel… incomplete without them. \u003c/span>\u003cspan style=\"font-weight: 400;\">\u003cbr>\n\u003c/span>\u003cspan style=\"font-weight: 400;\">\u003cbr>\n\u003c/span>\u003cb>Daniel Potter:\u003c/b>\u003cspan style=\"font-weight: 400;\"> And then there were the practical concerns, since Californians were quickly downing what trees \u003c/span>\u003ci>\u003cspan style=\"font-weight: 400;\">were \u003c/span>\u003c/i>\u003cspan style=\"font-weight: 400;\">here.\u003c/span>\u003c/p>\n\u003cp>\u003cb>Jared Farmer: \u003c/b>\u003cspan style=\"font-weight: 400;\">This was course just the era of wood power—wood was used for almost everything. For energy of course but also for building every city, for moving things around, all the things today we use concrete and plastic and steel.\u003c/span>\u003c/p>\n\u003cp>\u003cb>Daniel Potter: \u003c/b>\u003cspan style=\"font-weight: 400;\">So by the 1850s you could buy young eucalyptus in nurseries in San Francisco. It was grown here from seed, which meant it didn’t bring along any of the usual bugs or pathogens it faces back home. The lack of pests made it easy for these trees to grow really tall, really fast.\u003c/span>\u003c/p>\n\u003cp>\u003cb>\u003ci>(Berkeley outdoor ambi)\u003c/i>\u003c/b>\u003c/p>\n\u003cp>\u003cb>Joe McBride:\u003c/b>\u003cspan style=\"font-weight: 400;\"> I would say in an average rainfall year here in California, these trees probably put on four to six feet in height.\u003c/span>\u003c/p>\n\u003cp>\u003cb>Daniel Potter: \u003c/b>\u003cspan style=\"font-weight: 400;\">This is Joe McBride, professor emeritus of landscape architecture and environmental planning at UC Berkeley. I met him in a towering stand of ancient eucalyptus on campus.\u003c/span>\u003c/p>\n\u003cp>\u003cb>Joe McBride: \u003c/b>\u003cspan style=\"font-weight: 400;\">These trees are now over 200 feet tall, and the largest ones are approaching six feet in diameter.\u003c/span>\u003c/p>\n\u003cp>\u003cb>Daniel Potter: \u003c/b>\u003cspan style=\"font-weight: 400;\">Near the present-day Life Sciences building there used to be a cinder running track—picture fine ashen gravel. A hundred and forty years ago \u003c/span>\u003cspan style=\"font-weight: 400;\">…\u003c/span>\u003cspan style=\"font-weight: 400;\"> at a fabled track meet with Stanford … supposedly the wind was so bad it blew cinder in everyone’s faces and the Stanford coach took his team home—track meet \u003c/span>\u003ci>\u003cspan style=\"font-weight: 400;\">over\u003c/span>\u003c/i>\u003cspan style=\"font-weight: 400;\">.\u003c/span>\u003c/p>\n\u003cp>\u003cb>Joe McBride:\u003c/b>\u003cspan style=\"font-weight: 400;\"> As a result of that, the campus planted this grove of eucalyptus trees as a windbreak, to prevent the wind from blowing the cinders into other athletes eyes in the future. This is the largest, densest stand of blue gum eucalyptus in the world.\u003c/span>\u003c/p>\n\u003cp>\u003cb>Olivia Allen-Price: \u003c/b>\u003cspan style=\"font-weight: 400;\">Tell us what that is— blue gum eucalyptus…\u003c/span>\u003c/p>\n\u003cp>\u003cb>Daniel Potter:\u003c/b>\u003cspan style=\"font-weight: 400;\"> So, the genus eucalyptus includes hundreds of species—some more like shrubs than giant trees. A lot were tried out here, but the main one today is Tasmanian blue gum, eucalyptus globulus. Side note: apparently even botanists can’t always tell what species they’re looking at without climbing way up to check out the fruit… \u003c/span>\u003c/p>\n\u003cp>\u003cb>Olivia Allen-Price: \u003c/b>\u003cspan style=\"font-weight: 400;\">So for a time these trees were planted on purpose – but many people came to hate them. What changed?\u003c/span>\u003c/p>\n\u003cp>\u003cb>Jared Farmer:\u003c/b>\u003cspan style=\"font-weight: 400;\"> If you go back to California farm journals of the 1870s, 80s, 90s, there’s report after report of disappointment, like these trees are no good.\u003c/span>\u003c/p>\n\u003cp>\u003cb>Daniel Potter: \u003c/b>\u003cspan style=\"font-weight: 400;\">That’s Jared Farmer, the historian again. It turns out while our blue gum gets tall real fast, it’s not ideal for woodworking—it splits and cracks and doesn’t hold up if you’re making railroad ties. It also sucks up a lot of water, which is handy if you’re trying to drain swampland, but less handy if your well is nearby. People were kinda over it. Until!\u003c/span>\u003c/p>\n\u003cp>\u003cb>Joe McBride: \u003c/b>\u003cspan style=\"font-weight: 400;\">At the turn of the 20\u003c/span>\u003cspan style=\"font-weight: 400;\">th\u003c/span>\u003cspan style=\"font-weight: 400;\"> century, we were faced with a crisis in terms of hardwood forest that had been cut over in the eastern United States.\u003c/span>\u003c/p>\n\u003cp>\u003cb>Daniel Potter: \u003c/b>\u003cspan style=\"font-weight: 400;\">In 1907, the U.S. Forest Service predicted a looming hardwood famine. People thought there was only about a 15-year supply before we ran out of usable forest. That gave eucalyptus boosters an idea: plant now, and fast-growing blue gums could be big enough to harvest once the famine hits.\u003c/span>\u003c/p>\n\u003cp>\u003cb>Joe McBride: \u003c/b>\u003cspan style=\"font-weight: 400;\">Here in the Bay Area, for $100 you could buy an acre of land… planting those trees on 6 by 6 spacing, about 1,200 trees per acre. So they sold lots of these on a speculative basis.\u003c/span>\u003c/p>\n\u003cp>\u003cb>Daniel Potter: \u003c/b>\u003cspan style=\"font-weight: 400;\">This became a frenzy—a bubble. Companies suckered investors with claims like \u003c/span>\u003cb>\u003ci>“\u003c/i>\u003c/b>\u003cspan style=\"font-weight: 400;\">Forests Grown While You Wait” and “Absolute Security and Absolute Certainty.” Within a few years, thousands of acres were bought up and planted with eucalyptus, from Southern California up to Mendocino.\u003c/span>\u003c/p>\n\u003cp>\u003cb>Olivia Allen-Price:\u003c/b>\u003cspan style=\"font-weight: 400;\"> Wait, didn’t we just say blue gum was terrible for woodworking? Why was everyone still planting it?\u003c/span>\u003c/p>\n\u003cp>\u003cb>Daniel Potter:\u003c/b>\u003cspan style=\"font-weight: 400;\"> In his book, Farmer gives a few reasons: blue gum was familiar, seeds were everywhere, it could grow in lousy soil—plus a blend of historical ignorance and artful deception.\u003c/span>\u003c/p>\n\u003cp>\u003cb>Jared Farmer:\u003c/b>\u003cspan style=\"font-weight: 400;\"> In part because these people were not reading farm reports from the 1870s and 1880s, and even if they did read them maybe they wouldn’t care because they just wanted to make a buck, they were just flipping land.\u003c/span>\u003c/p>\n\u003cp>\u003cb>Daniel Potter: \u003c/b>\u003cspan style=\"font-weight: 400;\">Fears of a hardwood famine ultimately proved overblown. Concrete and steel became cheaper, forests further east recovered, and people started making furniture from imported wood like mahogany instead. California’s eucalyptus trees weren’t even worth cutting down—so there they stand. They’re like century-old abandoned crops. Farmer describes their presence here as a beautiful mistake. \u003c/span>\u003c/p>\n\u003cp>\u003cb>Olivia Allen-Price: \u003c/b>\u003cspan style=\"font-weight: 400;\">That brings us to the second half of this week’s question from Julie and Christian:\u003c/span>\u003c/p>\n\u003cp>\u003cb>Julie Bergen: \u003c/b>\u003cspan style=\"font-weight: 400;\">I know that they’re invasive, so what do we do about that?\u003c/span>\u003c/p>\n\u003cp>\u003cb>Christian Wagner: \u003c/b>\u003cspan style=\"font-weight: 400;\">To what extent is it sort of here to stay?\u003c/span>\u003c/p>\n\u003cp>\u003cb>Daniel Potter:\u003c/b>\u003cspan style=\"font-weight: 400;\"> I took this question to Jenn Yost, a botanist at CalPoly. While some people see California’s eucalyptus trees as a heinous invasive species and want them gone, Yost was careful to delineate between \u003c/span>\u003ci>\u003cspan style=\"font-weight: 400;\">non-native\u003c/span>\u003c/i>\u003cspan style=\"font-weight: 400;\">—which these trees definitely are—and \u003c/span>\u003ci>\u003cspan style=\"font-weight: 400;\">invasive\u003c/span>\u003c/i>\u003cspan style=\"font-weight: 400;\">.\u003c/span>\u003c/p>\n\u003cp>\u003cb>Jenn Yost:\u003c/b>\u003cspan style=\"font-weight: 400;\"> Just because something reproduces a little bit, sometimes it doesn’t do it enough where it has an ecological impact. And as soon as it starts outcompeting native species or fundamentally changing the environment so that native species can’t grow there, we would consider that an invasive species.\u003c/span>\u003c/p>\n\u003cp>\u003cb>Daniel Potter: \u003c/b>\u003cspan style=\"font-weight: 400;\">While many kinds of eucalyptus have been tried out in California, only \u003c/span>\u003ci>\u003cspan style=\"font-weight: 400;\">two\u003c/span>\u003c/i>\u003cspan style=\"font-weight: 400;\"> are good enough at reproducing here to be considered \u003c/span>\u003ci>\u003cspan style=\"font-weight: 400;\">invasive\u003c/span>\u003c/i>\u003cspan style=\"font-weight: 400;\">: the red gum and the blue gum. And those don’t seem able to reproduce just \u003c/span>\u003ci>\u003cspan style=\"font-weight: 400;\">anywhere\u003c/span>\u003c/i>\u003cspan style=\"font-weight: 400;\">. In some drier parts of the state, the old plantations aren’t spreading.\u003c/span>\u003c/p>\n\u003cp>\u003cb>Jenn Yost:\u003c/b>\u003cspan style=\"font-weight: 400;\"> You see blue gums being weedy and really reproducing on their own in areas that have summer moisture, and that’s usually in the form of fog. Or you see them being weedy in places with year-round water, like irrigation ditches or places with seeps.\u003c/span>\u003c/p>\n\u003cp>\u003cb>Daniel Potter:\u003c/b>\u003cspan style=\"font-weight: 400;\"> Blue gum is classified as a “moderate invasive.” Compared to other, faster-moving weeds, it’s not California’s most-wanted ravaging the countryside. Yost attributes a lot of the current resentment to the historic 1991 fire in the East Bay hills, where tons of eucalyptus burned.\u003c/span>\u003c/p>\n\u003cp>\u003cb>Jenn Yost:\u003c/b>\u003cspan style=\"font-weight: 400;\"> People at the time I don’t think associated that with a planted plantation; it was just a eucalyptus forest. And then when the fire came through—I mean that fire came through so fast and so hot and so many people lost their homes that it was a natural reaction to hate blue gums at that point.\u003c/span>\u003c/p>\n\u003cp>\u003cb>Archival tape: \u003c/b>\u003cspan style=\"font-weight: 400;\">Pushed by 30 mile per hour winds, fire swept down the Oakland Berkeley hills destroying everything in its path.\u003c/span>\u003c/p>\n\u003cp>\u003cb>Olivia Allen-Price: \u003c/b>\u003cspan style=\"font-weight: 400;\">The East Bay Hills fire was hugely devastating… 25 people died and thousands were left homeless. Many experts say that eucalyptus trees worsen the fire threat for a few reasons… The bark they shed dries out quickly and creates fuel…a lot of fuel. Once a fire starts, that bark easily catches the wind and can be blown miles away, spreading the fire quickly. Also: Eucalyptus trees are really oily. The oil is actually what gives off that intense fragrance they’re known for. But in a fire, that oil also makes them flammable.\u003c/span>\u003c/p>\n\u003cp>\u003cb>Daniel Potter:\u003c/b>\u003cspan style=\"font-weight: 400;\"> Other folks argue different plants in their place would also burn. \u003c/span>\u003cspan style=\"font-weight: 400;\">This is an entrenched debate! A few years ago there was federal fire-prevention funding to cut down trees in those same hills, and people protested. Folks got naked and hugged the blue gums on campus at Berkeley. \u003c/span>\u003c/p>\n\u003cp>\u003cb>Olivia Allen-Price:\u003c/b>\u003cspan style=\"font-weight: 400;\"> But after a nearly decade-long legal battle, a court gave UC Berkeley the go-ahead to cut down dozens of acres of Eucalyptus last year. Still, it’s a drop in the bucket when you think about how many of these trees we have in California.\u003c/span>\u003c/p>\n\u003cp>\u003cb>Daniel Potter: \u003c/b>\u003cspan style=\"font-weight: 400;\">Yost estimates there’s something like 40 thousand acres of unharvested crops in the state. It’s not hard to extrapolate upwards of ten million trees statewide. Cutting each one down takes time and money.\u003c/span>\u003c/p>\n\u003cp>\u003cb>Olivia Allen-Price: \u003c/b>\u003cspan style=\"font-weight: 400;\">So really the question of whether eucalyptus is going away comes down to who’s backyard it’s in. Can they afford to cut the trees down? Is the political will there to do it? \u003c/span>\u003cspan style=\"font-weight: 400;\">\u003cbr>\n\u003c/span>\u003cspan style=\"font-weight: 400;\">\u003cbr>\n\u003c/span>\u003ci>\u003cspan style=\"font-weight: 400;\">Music\u003c/span>\u003c/i>\u003c/p>\n\u003cp>\u003cb>Olivia Allen-Price: \u003c/b>\u003cspan style=\"font-weight: 400;\">So that’s where things are. What did our question askers think? Christian and Julie.\u003c/span>\u003c/p>\n\u003cp>\u003cb>Julie Bergen:\u003c/b> \u003cspan style=\"font-weight: 400;\">That was absolutely fascinating. I did not know that the history was even that rich.\u003cbr>\n\u003c/span>\u003cspan style=\"font-weight: 400;\">\u003cbr>\n\u003c/span>\u003cb>Christian Wagner: \u003c/b>\u003cspan style=\"font-weight: 400;\">I have to say I love the idea that a lot of what we see was a get-rich-quick scheme. Because that is just a theme that happens so often in America and in California.\u003c/span>\u003c/p>\n\u003cp>\u003cb>Olivia Allen-Price: \u003c/b>\u003cspan style=\"font-weight: 400;\">So often to our detriment. Science Writer Daniel Potter, thanks for stomping around so many forests for us this week. \u003c/span>\u003c/p>\n\u003cp>\u003cb>Daniel Potter: \u003c/b>\u003cspan style=\"font-weight: 400;\">Happy to do it!\u003c/span>\u003c/p>\n\u003cp>\u003ci>\u003cspan style=\"font-weight: 400;\">music\u003c/span>\u003c/i>\u003cspan style=\"font-weight: 400;\">\u003cbr>\n\u003c/span>\u003cspan style=\"font-weight: 400;\">\u003cbr>\n\u003c/span>\u003cb>Olivia Allen-Price: \u003c/b>\u003cspan style=\"font-weight: 400;\">A note: A few of the sources quoted in his story have changed jobs since they were first interviewed in 2018.\u003c/span>\u003c/p>\n\u003cp>\u003cb>Olivia Allen-Price: \u003c/b>\u003cspan style=\"font-weight: 400;\">If you’ve ever wondered what all goes into making a Bay Curious story sound the way it does … join producer Katrina Schwartz and I TONIGHT, April 11 for our talk: Elevating Audio Stories with Sound for the PRX Podcast Garage. We’ll be talking through how we use music, sound effects, archival material, narration and more to bring the Bay Curious podcast to life. Join us in person at KQED’s Headquarters, or on the livestream. Tickets are free if you use the code “baycurious.” Grab yours at \u003c/span>\u003ca href=\"http://kqed.org/podcast\">\u003cspan style=\"font-weight: 400;\">kqed.org/podcastgarage\u003c/span>\u003c/a>\u003c/p>\n\u003cp>\u003cb>Olivia Allen-Price: \u003c/b>\u003cspan style=\"font-weight: 400;\">Bay Curious is made by Katrina Schwartz, Christopher Beale, and me, Olivia-Allen Price. Additional support from Jen Chien, Katie Sprenger, Cesar Saldana, Maha Sanad, Holly Kernan and the whole KQED Family. \u003c/span>\u003c/p>\n\u003cp>\u003cb>Christian Wagner:\u003c/b>\u003cspan style=\"font-weight: 400;\"> Bay Curious is made in San Francisco at KQED. \u003c/span>\u003c/p>\n\u003cp>[ad floatright]\u003c/p>\n\u003cp>\u003cb>Olivia Allen-Price: \u003c/b>\u003cspan style=\"font-weight: 400;\">I’m Olivia Allen-Price. Have a great week!\u003c/span>\u003c/p>\n\n","blocks":[],"excerpt":"Depending on whom you ask, eucalyptus trees are either an icon in California or a fire-prone scourge.","status":"publish","parent":0,"modified":1712783726,"stats":{"hasAudio":false,"hasVideo":false,"hasChartOrMap":false,"iframeSrcs":[],"hasGoogleForm":false,"hasGallery":false,"hasHearkenModule":true,"hasPolis":false,"paragraphCount":118,"wordCount":4111},"headData":{"title":"Eucalyptus: How California's Most Hated Tree Took Root | KQED","description":"Depending on whom you ask, eucalyptus trees are either an icon in California or a fire-prone scourge.","ogTitle":"","ogDescription":"","ogImgId":"","twTitle":"","twDescription":"","twImgId":"","schema":{"@context":"http://schema.org","@type":"NewsArticle","headline":"Eucalyptus: How California's Most Hated Tree Took Root","datePublished":"2024-04-11T10:00:45.000Z","dateModified":"2024-04-10T21:15:26.000Z","image":"https://cdn.kqed.org/wp-content/uploads/2020/02/KQED-OG-Image@1x.png","isAccessibleForFree":"Y","publisher":{"@type":"NewsMediaOrganization","@id":"https://www.kqed.org/#organization","name":"KQED","url":"https://www.kqed.org","logo":"https://cdn.kqed.org/wp-content/uploads/2020/02/KQED-OG-Image@1x.png"}}},"source":"Bay Curious","audioUrl":"https://www.podtrac.com/pts/redirect.mp3/pdst.fm/e/chrt.fm/track/G6C7C3/traffic.megaphone.fm/KQINC6716621061.mp3?updated=1712782612","sticky":false,"nprByline":"\u003cstrong>Daniel Potter\u003c/strong>","excludeFromSiteSearch":"Include","showOnAuthorArchivePages":"No","articleAge":"0","path":"/news/11644927/eucalyptus-how-californias-most-hated-tree-took-root-2","audioTrackLength":null,"parsedContent":[{"type":"contentString","content":"\u003cdiv class=\"post-body\">\u003cp>\u003cp>\u003ca href=\"#episode-transcript\">\u003ci>View the full episode transcript.\u003c/i>\u003c/a> \u003cem>This article was first published in February 1, 2018, and was updated on April 11, 2024. \u003c/em>\u003c/p>\n\u003cp>Depending on whom you ask, eucalyptus trees are either an icon in California or a fire-prone scourge.\u003c/p>\n\u003cp>Bay Curious heard from two hikers wanting to know about the past and future of California’s eucalyptus trees.\u003c/p>\n\u003cp>\u003c/p>\u003cp>\u003caside class=\"alignleft utils-parseShortcode-shortcodes-__bayCuriousPodcastShortcode__bayCurious\">\u003cimg src=https://cdn.kqed.org/wp-content/uploads/2023/02/bayCuriousLogo.png alt=\"Bay Curious Podcast\" />\n \u003ca href=\"/news/series/baycurious\">Bay Curious\u003c/a> is a podcast that answers your questions about the Bay Area.\n Subscribe on \u003ca href=\"https://itunes.apple.com/us/podcast/bay-curious/id1172473406\" target=\"_blank\" rel=\"noopener noreferrer\">Apple Podcasts\u003c/a>,\n \u003ca href=\"http://www.npr.org/podcasts/500557090/bay-curious\" target=\"_blank\" rel=\"noopener noreferrer\">NPR One\u003c/a> or your favorite podcast platform.\u003c/aside>\u003c/p>\u003cp>\u003c/p>\n\u003cp>“How did all of this eucalyptus get to the Bay Area?” asked Christian Wagner, a tech worker who lives in Pleasanton.\u003c/p>\n\u003cp>\u003c/p>\u003c/div>","attributes":{"named":{},"numeric":[]}},{"type":"component","content":"","name":"ad","attributes":{"named":{"label":"fullwidth"},"numeric":["fullwidth"]}},{"type":"contentString","content":"\u003cdiv class=\"post-body\">\u003cp>\u003c/p>\n\u003cp>“I know that they’re invasive, so what do we do about that? Are they worth keeping around? Or do we need to get rid of them and replace them with something else?” wondered Julie Bergen, an occupational therapist from Alameda.\u003c/p>\n\u003cp>Reaching heights of more than 100 feet, the main kind of eucalyptus you’re likely to see here is Tasmanian blue gum, eucalyptus globulus. They feature sickle-shaped leaves hanging from high branches, and deciduous bark that is forever peeling from their shaggy trunks. Some people experience the smell of eucalyptus as medicinal; others say the trees just smell like California.\u003c/p>\n\u003cfigure id=\"attachment_11647124\" class=\"wp-caption aligncenter\" style=\"max-width: 800px\">\u003cimg loading=\"lazy\" decoding=\"async\" class=\"wp-image-11647124 size-medium\" src=\"https://ww2.kqed.org/news/wp-content/uploads/sites/10/2018/01/RS29068_eucalyptusgrove7-800x533.jpg\" alt=\"The trees are deciduous, shedding their bark every year.\" width=\"800\" height=\"533\" srcset=\"https://cdn.kqed.org/wp-content/uploads/sites/10/2018/01/RS29068_eucalyptusgrove7-800x533.jpg 800w, https://cdn.kqed.org/wp-content/uploads/sites/10/2018/01/RS29068_eucalyptusgrove7-160x107.jpg 160w, https://cdn.kqed.org/wp-content/uploads/sites/10/2018/01/RS29068_eucalyptusgrove7-1020x680.jpg 1020w, https://cdn.kqed.org/wp-content/uploads/sites/10/2018/01/RS29068_eucalyptusgrove7-1920x1280.jpg 1920w, https://cdn.kqed.org/wp-content/uploads/sites/10/2018/01/RS29068_eucalyptusgrove7-1180x787.jpg 1180w, https://cdn.kqed.org/wp-content/uploads/sites/10/2018/01/RS29068_eucalyptusgrove7-960x640.jpg 960w, https://cdn.kqed.org/wp-content/uploads/sites/10/2018/01/RS29068_eucalyptusgrove7-240x160.jpg 240w, https://cdn.kqed.org/wp-content/uploads/sites/10/2018/01/RS29068_eucalyptusgrove7-375x250.jpg 375w, https://cdn.kqed.org/wp-content/uploads/sites/10/2018/01/RS29068_eucalyptusgrove7-520x347.jpg 520w\" sizes=\"(max-width: 800px) 100vw, 800px\">\u003cfigcaption class=\"wp-caption-text\">The trees are deciduous, shedding their bark every year. \u003ccite>(Samantha Shanahan/KQED)\u003c/cite>\u003c/figcaption>\u003c/figure>\n\u003ch2>So how did eucalyptus trees get here?\u003c/h2>\n\u003cp>“They came here as envelopes of seeds on boats coming to California in the 1850s,” explains Jared Farmer, author of \u003ca href=\"https://jaredfarmer.net/books/trees-in-paradise/\">“Trees In Paradise: A California History.”\u003c/a>\u003c/p>\n\u003cp>During the Gold Rush, Australians were among the throngs flocking to a place where wood was in short supply.\u003c/p>\n\u003cp>“This was the era of wood power,” Farmer says. “Wood was used for almost everything. For energy, of course, but also for building every city, for moving things around, all the things where today we use concrete and plastic and steel.”\u003c/p>\n\u003cp>Besides the practical need to plant more trees, settlers who were used to dense forests also felt that the lack of trees in California’s grassy, marshy, scrubby landscape made it feel incomplete. So within a few years, nurseries in San Francisco were selling young eucalyptus grown from seed.\u003c/p>\n\u003cp>The trees grew remarkably quickly here, even in poor soil.\u003c/p>\n\u003cp>“In an average rainfall year here in California, these trees probably put on 4 to 6 feet in height and maybe, in their early growth years, a half-inch to an inch in diameter,” says Joe McBride, a UC Berkeley professor emeritus of landscape architecture and environmental planning.\u003c/p>\n\u003cp>Beyond the drive to change the landscape and provide firewood, Californians also planted eucalyptus (mainly blue gum) to serve as windbreaks.\u003c/p>\n\u003cfigure id=\"attachment_11647125\" class=\"wp-caption aligncenter\" style=\"max-width: 800px\">\u003cimg loading=\"lazy\" decoding=\"async\" class=\"wp-image-11647125 size-medium\" src=\"https://ww2.kqed.org/news/wp-content/uploads/sites/10/2018/01/RS29071_eucalyptusgrove10-800x533.jpg\" alt=\"Eucalyptus trees grow fast, sometimes putting on four to six feet in height in a single year.\" width=\"800\" height=\"533\" srcset=\"https://cdn.kqed.org/wp-content/uploads/sites/10/2018/01/RS29071_eucalyptusgrove10-800x533.jpg 800w, https://cdn.kqed.org/wp-content/uploads/sites/10/2018/01/RS29071_eucalyptusgrove10-160x107.jpg 160w, https://cdn.kqed.org/wp-content/uploads/sites/10/2018/01/RS29071_eucalyptusgrove10-1020x680.jpg 1020w, https://cdn.kqed.org/wp-content/uploads/sites/10/2018/01/RS29071_eucalyptusgrove10-1920x1280.jpg 1920w, https://cdn.kqed.org/wp-content/uploads/sites/10/2018/01/RS29071_eucalyptusgrove10-1180x787.jpg 1180w, https://cdn.kqed.org/wp-content/uploads/sites/10/2018/01/RS29071_eucalyptusgrove10-960x640.jpg 960w, https://cdn.kqed.org/wp-content/uploads/sites/10/2018/01/RS29071_eucalyptusgrove10-240x160.jpg 240w, https://cdn.kqed.org/wp-content/uploads/sites/10/2018/01/RS29071_eucalyptusgrove10-375x250.jpg 375w, https://cdn.kqed.org/wp-content/uploads/sites/10/2018/01/RS29071_eucalyptusgrove10-520x347.jpg 520w\" sizes=\"(max-width: 800px) 100vw, 800px\">\u003cfigcaption class=\"wp-caption-text\">Eucalyptus trees grow fast, sometimes putting on 4 to 6 feet in height in a single year. \u003ccite>(Samantha Shanahan/KQED)\u003c/cite>\u003c/figcaption>\u003c/figure>\n\u003cp>In fact, that was the original purpose of what’s now the largest, densest stand of blue gum eucalyptus in the world, on campus at Berkeley, says McBride. It was planted around 140 years ago to provide a windbreak for an old cinder running track — to keep its fine ashen gravel from blowing into athletes’ faces.\u003c/p>\n\u003cp>The trees’ success in California owed to a lack of enemies here. Because they were grown from seed, they hadn’t brought along any of the pests or pathogens they contend with back in Australia.\u003c/p>\n\u003ch2>An early 20th century boom\u003c/h2>\n\u003cp>Within a few decades of its arrival, many Californians grew disenchanted with eucalyptus. Blue gum proved terrible for woodworking — the wood often split and cracked, making it a poor choice for railroad ties. The trees also proved thirsty enough to drain nearby wells.\u003c/p>\n\u003cp>“If you go back to California farm journals of the 1870s, ’80s, ’90s, there’s just report after report of disappointment, like ‘these trees are no good,’ ” says Farmer, the historian.\u003c/p>\n\u003cp>But things changed in the early 20th century when U.S. Forest Service officials grew concerned about a looming timber famine. They feared forests in the eastern United States had been overexploited and wouldn’t grow back, and predicted the supply of hardwood would dwindle over the next 15 years.\u003c/p>\n\u003cfigure id=\"attachment_11647127\" class=\"wp-caption aligncenter\" style=\"max-width: 800px\">\u003cimg loading=\"lazy\" decoding=\"async\" class=\"wp-image-11647127 size-medium\" src=\"https://ww2.kqed.org/news/wp-content/uploads/sites/10/2018/01/RS29072_eucalyptusgrove11-800x533.jpg\" alt=\"The bark sheds often, peeling in large strips.\" width=\"800\" height=\"533\" srcset=\"https://cdn.kqed.org/wp-content/uploads/sites/10/2018/01/RS29072_eucalyptusgrove11-800x533.jpg 800w, https://cdn.kqed.org/wp-content/uploads/sites/10/2018/01/RS29072_eucalyptusgrove11-160x107.jpg 160w, https://cdn.kqed.org/wp-content/uploads/sites/10/2018/01/RS29072_eucalyptusgrove11-1020x680.jpg 1020w, https://cdn.kqed.org/wp-content/uploads/sites/10/2018/01/RS29072_eucalyptusgrove11-1920x1280.jpg 1920w, https://cdn.kqed.org/wp-content/uploads/sites/10/2018/01/RS29072_eucalyptusgrove11-1180x787.jpg 1180w, https://cdn.kqed.org/wp-content/uploads/sites/10/2018/01/RS29072_eucalyptusgrove11-960x640.jpg 960w, https://cdn.kqed.org/wp-content/uploads/sites/10/2018/01/RS29072_eucalyptusgrove11-240x160.jpg 240w, https://cdn.kqed.org/wp-content/uploads/sites/10/2018/01/RS29072_eucalyptusgrove11-375x250.jpg 375w, https://cdn.kqed.org/wp-content/uploads/sites/10/2018/01/RS29072_eucalyptusgrove11-520x347.jpg 520w\" sizes=\"(max-width: 800px) 100vw, 800px\">\u003cfigcaption class=\"wp-caption-text\">The bark sheds often, peeling in large strips. \u003ccite>(Samantha Shanahan/KQED)\u003c/cite>\u003c/figcaption>\u003c/figure>\n\u003cp>Investors saw an opportunity: California had a tree capable of growing to full size within that time frame. If hardwood was about to be scarce, they reasoned, such trees could be in high demand and yield sizable returns within a few short years.\u003c/p>\n\u003cp>These people, Farmer says, were not reading blue gum’s lousy reviews in old farm reports. “And even if they did read them, maybe they wouldn’t care because they just wanted to make a buck; they were just flipping land.”\u003c/p>\n\u003cp>This played out as a speculative frenzy — a bubble. Boosters began selling plantations dense with eucalyptus — hundreds of trees per acre. Farmer writes in his book that claims were made like: “Forests Grown While You Wait,” and “Absolute Security and Absolute Certainty.” In just a few years, millions of blue gums were planted from Southern California up to Mendocino.\u003c/p>\n\u003cp>The anticipated timber famine never came to pass. Forests further east proved more resilient than expected, and the need was offset by concrete, steel and imports, like mahogany. Ultimately, the thousands of acres of eucalyptus planted around California were not even worth cutting down. Much of what you see today is a century-old abandoned crop.\u003c/p>\n\u003ch2>What’s fire got to do with it?\u003c/h2>\n\u003cp>Eucalyptus trees have lovers and haters in California. A big part of the debate over whether the trees should be allowed to persist here traces back to the East Bay firestorm of 1991, which left 25 people dead and thousands homeless. Vast swaths of eucalyptus burned.\u003c/p>\n\u003cp>“People at the time, I don’t think, associated that with a planted plantation; it was just a eucalyptus forest,” says CalPoly botanist Jenn Yost. “And then when the fire came through — I mean that fire came through so fast and so hot and so many people lost their homes that it was a natural reaction to hate blue gums at that point.”\u003c/p>\n\u003cp>Many experts say that eucalyptus trees worsen the fire threat for a few reasons.\u003c/p>\n\u003cul>\n\u003cli>The bark they shed dries out quickly and creates fuel.\u003c/li>\n\u003cli>Once a fire starts, that bark easily catches the wind and can be blown miles away, spreading the fire quickly.\u003c/li>\n\u003cli>Eucalyptus trees are really oily. The oil is actually what gives off that intense fragrance they’re known for. But in a fire, that oil also makes them flammable.\u003c/li>\n\u003c/ul>\n\u003cp>But Eucalyptus trees have supporters too, who argue other plants in their place would also burn. A few years ago, federal funding to cut down trees in the East Bay hills was \u003ca href=\"http://www.berkeleyside.com/2016/09/19/fema-pulls-funding-for-tree-clearing-in-berkeley-hills/\" target=\"_blank\" rel=\"noopener\">rescinded\u003c/a>, after \u003ca href=\"http://www.berkeleyside.com/2015/07/18/in-berkeley-protesters-strip-naked-to-try-to-save-trees/\" target=\"_blank\" rel=\"noopener\">protesters\u003c/a> got naked and hugged the eucalyptus trees on campus at Cal. \u003cspan style=\"font-weight: 400;\">But after a nearly decade-long legal battle, a court gave UC Berkeley the go-ahead to cut. Still, it’s a drop in the bucket when you think about how many of these trees we have in California.\u003c/span>\u003c/p>\n\u003cfigure id=\"attachment_11647123\" class=\"wp-caption alignright\" style=\"max-width: 640px\">\u003cimg loading=\"lazy\" decoding=\"async\" class=\"size-large wp-image-11647123\" src=\"https://ww2.kqed.org/news/wp-content/uploads/sites/10/2018/01/RS29066_eucalyptusgrove2-1020x1530.jpg\" alt=\"To some, the scent of eucalyptus trees is simply the scent of California.\" width=\"640\" height=\"960\" srcset=\"https://cdn.kqed.org/wp-content/uploads/sites/10/2018/01/RS29066_eucalyptusgrove2-1020x1530.jpg 1020w, https://cdn.kqed.org/wp-content/uploads/sites/10/2018/01/RS29066_eucalyptusgrove2-160x240.jpg 160w, https://cdn.kqed.org/wp-content/uploads/sites/10/2018/01/RS29066_eucalyptusgrove2-800x1200.jpg 800w, https://cdn.kqed.org/wp-content/uploads/sites/10/2018/01/RS29066_eucalyptusgrove2-1920x2880.jpg 1920w, https://cdn.kqed.org/wp-content/uploads/sites/10/2018/01/RS29066_eucalyptusgrove2-1180x1770.jpg 1180w, https://cdn.kqed.org/wp-content/uploads/sites/10/2018/01/RS29066_eucalyptusgrove2-960x1440.jpg 960w, https://cdn.kqed.org/wp-content/uploads/sites/10/2018/01/RS29066_eucalyptusgrove2-240x360.jpg 240w, https://cdn.kqed.org/wp-content/uploads/sites/10/2018/01/RS29066_eucalyptusgrove2-375x563.jpg 375w, https://cdn.kqed.org/wp-content/uploads/sites/10/2018/01/RS29066_eucalyptusgrove2-520x780.jpg 520w\" sizes=\"(max-width: 640px) 100vw, 640px\">\u003cfigcaption class=\"wp-caption-text\">To some, the scent of eucalyptus trees is simply the scent of California. \u003ccite>(Samantha Shanahan/KQED)\u003c/cite>\u003c/figcaption>\u003c/figure>\n\u003ch2>Are they here to stay?\u003c/h2>\n\u003cp>Blue gums can’t reproduce on their own just anywhere in California; Yost says they need year-round moisture. They’re able to regenerate in places like California’s coastal fog belt, but elsewhere “there are some plantations that don’t reproduce at all. When you go there, the trees are all in their rows, there’s few saplings anywhere to be seen, and those trees are just getting older.”\u003c/p>\n\u003cp>Not all non-native plants capable of reproducing on their own do it enough to have an ecological impact, Yost says.\u003c/p>\n\u003cp>“As soon as it starts outcompeting native species or fundamentally changing the environment so that native species can’t grow there, we would consider that an invasive species,” she says.\u003c/p>\n\u003cp>Blue gum is \u003ca href=\"http://www.cal-ipc.org/wp-content/uploads/2017/03/Cal-IPC_News_Summer2014-6.pdf#page=10\" target=\"_blank\" rel=\"noopener\">classified\u003c/a> as a “moderate” invasive, putting it a \u003ca href=\"http://www.cal-ipc.org/plants/inventory/\" target=\"_blank\" rel=\"noopener\">tier\u003c/a> below such uncharismatic weeds as yellow star-thistle and medusahead. McBride, the retired Berkeley professor, says “although there’s been marginal expansion of some eucalyptus stands, it’s really not well adapted for long-distance dispersal. It hasn’t really spread very much on its own.”\u003c/p>\n\u003cp>\u003c/p>\u003cp>\u003caside class=\"alignleft utils-parseShortcode-shortcodes-__bayCuriousPodcastShortcode__bayCurious\">\u003cimg src=https://cdn.kqed.org/wp-content/uploads/2023/02/bayCuriousLogo.png alt=\"Bay Curious Podcast\" />\n What do you wonder about the Bay Area, its culture or people that you want KQED to investigate?\n \u003ca href=\"/news/series/baycurious\">Ask Bay Curious.\u003c/a>\u003c/aside>\u003c/p>\u003cp>\u003c/p>\n\u003cp>With an estimated 40,000 acres of unharvested eucalyptus planted across the state, the trees aren’t easy to get rid of. Slicing down a large blue gum near a building can require a crane, at an expense of thousands of dollars. And keeping them from resprouting can also be its own chore.\u003c/p>\n\u003cp>Long term, as the climate changes over the coming decades, it’s possible the aging eucalyptus groves that don’t get enough water to reproduce will begin to die.\u003c/p>\n\u003cp>Then again, if the state becomes \u003ca href=\"https://ww2.kqed.org/science/2015/02/12/new-study-global-warming-will-bring-megadroughts-to-the-west/\" target=\"_blank\" rel=\"noopener\">hotter and drier\u003c/a>, it may become the type of place where some Australian species are able to thrive.\u003c/p>\n\u003cp>\u003c/p>\u003c/div>","attributes":{"named":{},"numeric":[]}},{"type":"component","content":"","name":"baycuriousquestion","attributes":{"named":{"label":""},"numeric":[]}},{"type":"contentString","content":"\u003cdiv class=\"post-body\">\u003cp>\u003c/p>\n\u003ch2 id=\"episode-transcript\">Episode Transcript\u003c/h2>\n\u003cp>\u003cb>Olivia Allen-Price: \u003c/b>\u003cspan style=\"font-weight: 400;\">Do you see any koala bears?\u003c/span>\u003c/p>\n\u003cp>\u003cb>Daniel Potter:\u003c/b>\u003cspan style=\"font-weight: 400;\"> I wish.\u003c/span>\u003c/p>\n\u003cp>\u003cb>\u003ci>[sound of bark crunching underfoot]\u003c/i>\u003c/b>\u003c/p>\n\u003cp>\u003cb>Daniel Potter:\u003c/b>\u003cspan style=\"font-weight: 400;\"> Should we tell people where we are?\u003c/span>\u003c/p>\n\u003cp>\u003cb>Olivia Allen-Price: \u003c/b>\u003cspan style=\"font-weight: 400;\">Yeah, so we are at the Mount Sutro Open Space Reserve. Which has gotta be pretty close to the geographic center of San Francisco, would you imagine, right?\u003c/span>\u003c/p>\n\u003cp>\u003cb>Daniel Potter: \u003c/b>\u003cspan style=\"font-weight: 400;\">I think that’s fair. And we are surrounded by a ton of what look to be ancient eucalyptus trees.\u003c/span>\u003c/p>\n\u003cp>\u003cb>Olivia Allen-Price:\u003c/b>\u003cspan style=\"font-weight: 400;\"> If you’re not familiar with eucalyptus trees, they’re very tall. How tall would you say those are?\u003c/span>\u003c/p>\n\u003cp>\u003cb>Daniel Potter: \u003c/b>\u003cspan style=\"font-weight: 400;\">We’ve seen some today over a hundred feet, for sure.\u003c/span>\u003c/p>\n\u003cp>\u003cb>Olivia Allen-Price:\u003c/b>\u003cspan style=\"font-weight: 400;\"> Definitely. And they have this weird bark, where the underpart of the tree is really smooth but their bark on the outside flakes off.\u003c/span>\u003c/p>\n\u003cp>\u003cb>Daniel Potter:\u003c/b>\u003cspan style=\"font-weight: 400;\"> It’s deciduous, but it leaves this tan, almost naked-looking trunk behind.\u003c/span>\u003c/p>\n\u003cp>\u003cb>Olivia Allen-Price:\u003c/b>\u003cspan style=\"font-weight: 400;\"> And these would not be good climbing trees.\u003c/span>\u003c/p>\n\u003cp>\u003cb>Daniel Potter:\u003c/b>\u003cspan style=\"font-weight: 400;\"> Yeah, most of the branches, like, what’s the lowest branch on that one? It’s like 30 feet up, how are you gonna climb that?\u003c/span>\u003c/p>\n\u003cp>\u003cb>Olivia Allen-Price: \u003c/b>\u003cspan style=\"font-weight: 400;\">One thing I think a lot of people remark about eucalyptus trees in the smell.\u003c/span>\u003c/p>\n\u003cp>\u003cb>\u003ci>(inhale, exhale)\u003c/i>\u003c/b>\u003c/p>\n\u003cp>\u003cb>Daniel Potter: \u003c/b>\u003cspan style=\"font-weight: 400;\">Some people hate it. But a couple people I talked to for this story—they say these trees just smell like California.\u003c/span>\u003c/p>\n\u003cp>\u003cb>Olivia Allen-Price: \u003c/b>\u003cspan style=\"font-weight: 400;\">Which is pretty weird for a tree from Australia! \u003c/span>\u003c/p>\n\u003cp>\u003cb>\u003ci>Theme music\u003c/i>\u003c/b>\u003c/p>\n\u003cp>\u003cb>Olivia Allen-Price:\u003c/b>\u003cspan style=\"font-weight: 400;\"> I’m Olivia Allen-Price, and this is Bay Curious, where we answer your questions about the Bay Area. On this episode, science writer Daniel Potter and I take a closer look at Eucalyptus Trees.\u003c/span>\u003c/p>\n\u003cp>\u003cb>Daniel Potter: \u003c/b>\u003cspan style=\"font-weight: 400;\">They have lovers—and haters.\u003c/span>\u003c/p>\n\u003cp>\u003cb>Olivia Allen-Price: \u003c/b>\u003cspan style=\"font-weight: 400;\">And there are giant stands of them throughout our region. This story first ran in 2018, but your questions about eucalyptus trees have kept on coming! So we thought it was time to freshen up this episode with some new information. We’ll get to it right after this.\u003c/span>\u003c/p>\n\u003cp>\u003cb>\u003ci>Sponsor Message\u003c/i>\u003c/b>\u003c/p>\n\u003cp>\u003cb>Olivia Allen-Price: \u003c/b>\u003cspan style=\"font-weight: 400;\">Alright! Let’s get to this week’s question, shall we? Or should I say \u003c/span>\u003ci>\u003cspan style=\"font-weight: 400;\">QUESTIONS\u003c/span>\u003c/i>\u003cspan style=\"font-weight: 400;\"> because we heard from two different listeners on this one…\u003c/span>\u003c/p>\n\u003cp>\u003cb>Christian Wagner:\u003c/b>\u003cspan style=\"font-weight: 400;\"> How did all of this eucalyptus get to the Bay Area?\u003c/span>\u003c/p>\n\u003cp>\u003cb>Olivia Allen-Price: \u003c/b>\u003cspan style=\"font-weight: 400;\">That’s Christian Wagner. He’s noticed lots of eucalyptus trees as he’s out and about because he likes hiking.\u003c/span>\u003cspan style=\"font-weight: 400;\">\u003cbr>\n\u003c/span>\u003cspan style=\"font-weight: 400;\">\u003cbr>\n\u003c/span>\u003cb>Daniel Potter:\u003c/b>\u003cspan style=\"font-weight: 400;\"> –as does Julie Bergen.\u003c/span>\u003c/p>\n\u003cp>\u003cb>Julie Bergen:\u003c/b> \u003cspan style=\"font-weight: 400;\">And I know that they’re invasive, so what do we do about that? Are they worth keeping around? Or do we need to get rid of them and replace them with something else?\u003c/span>\u003c/p>\n\u003cp>\u003cb>Olivia Allen-Price:\u003c/b>\u003cspan style=\"font-weight: 400;\"> Christian and Julie both wonder about eucalyptus’ past—and its future here. Some people argue the trees are bad for \u003c/span>\u003ci>\u003cspan style=\"font-weight: 400;\">native\u003c/span>\u003c/i>\u003cspan style=\"font-weight: 400;\"> plant life—and a fire hazard—and need to go. So. Science writer Daniel Potter!\u003c/span>\u003c/p>\n\u003cp>\u003cb>Daniel Potter:\u003c/b>\u003cspan style=\"font-weight: 400;\"> Howdy.\u003c/span>\u003cspan style=\"font-weight: 400;\">\u003cbr>\n\u003c/span>\u003cspan style=\"font-weight: 400;\">\u003cbr>\n\u003c/span>\u003cb>Olivia Allen-Price: \u003c/b>\u003cspan style=\"font-weight: 400;\">Where do we begin unraveling this one?\u003c/span>\u003cspan style=\"font-weight: 400;\">\u003cbr>\n\u003c/span>\u003cspan style=\"font-weight: 400;\">\u003cbr>\n\u003c/span>\u003cb>Daniel Potter:\u003c/b>\u003cspan style=\"font-weight: 400;\"> In a forest. \u003c/span>\u003c/p>\n\u003cp>\u003cb>\u003ci>Albany Hill outdoor ambi\u003c/i>\u003c/b>\u003c/p>\n\u003cp>\u003cb>Daniel Potter:\u003c/b>\u003cspan style=\"font-weight: 400;\"> Let’s start with one on Albany Hill in the East Bay. You can see it from I-80, near the racetrack. That’s where I talked to this guy…\u003c/span>\u003c/p>\n\u003cp>\u003cb>Jared Farmer: \u003c/b>\u003cspan style=\"font-weight: 400;\">My name is Jared Farmer, I’m a professor of history at Stony Brook University, and the author of \u003c/span>\u003ci>\u003cspan style=\"font-weight: 400;\">Trees In Paradise: A California History\u003c/span>\u003c/i>\u003cspan style=\"font-weight: 400;\">.\u003c/span>\u003c/p>\n\u003cp>\u003cb>Daniel Potter: \u003c/b>\u003cspan style=\"font-weight: 400;\">That book includes a solid hundred pages on eucalyptus trees in California, so I asked Farmer how they got here:\u003c/span>\u003c/p>\n\u003cp>\u003cb>Jared Farmer: \u003c/b>\u003cspan style=\"font-weight: 400;\">They came here as envelopes of seeds on boats in the 1850s.\u003c/span>\u003c/p>\n\u003cp>\u003cb>Daniel Potter: \u003c/b>\u003cspan style=\"font-weight: 400;\">He says the Gold Rush drew people from all over—including from Australia. \u003c/span>\u003cspan style=\"font-weight: 400;\">\u003cbr>\n\u003c/span>\u003cspan style=\"font-weight: 400;\">\u003cbr>\n\u003c/span>\u003ci>\u003cspan style=\"font-weight: 400;\">Sea shanty music …“In South Australia I was born, heed away all the way”\u003c/span>\u003c/i>\u003cspan style=\"font-weight: 400;\">\u003cbr>\n\u003c/span>\u003cspan style=\"font-weight: 400;\">\u003cbr>\n\u003c/span>\u003cb>Daniel Potter: \u003c/b>\u003cspan style=\"font-weight: 400;\">And they were coming to a place where wood was in short supply. \u003c/span>\u003c/p>\n\u003cp>\u003cb>Jared Farmer: \u003c/b>\u003cspan style=\"font-weight: 400;\">What we think of today as like say native California, Indigenous California, or pre-contact California was far more woody than wooded. Actually it was far more land that was chaparral and savanna and wetland and marshland than timberland…\u003c/span>\u003c/p>\n\u003cp>\u003cb>Daniel Potter:\u003c/b>\u003cspan style=\"font-weight: 400;\"> People settling here wanted to plant trees. \u003c/span>\u003cspan style=\"font-weight: 400;\">\u003cbr>\n\u003c/span>\u003cspan style=\"font-weight: 400;\">\u003cbr>\n\u003c/span>\u003cb>Olivia Allen-Price: \u003c/b>\u003cspan style=\"font-weight: 400;\">If you’re used to trees, the California landscape might feel… incomplete without them. \u003c/span>\u003cspan style=\"font-weight: 400;\">\u003cbr>\n\u003c/span>\u003cspan style=\"font-weight: 400;\">\u003cbr>\n\u003c/span>\u003cb>Daniel Potter:\u003c/b>\u003cspan style=\"font-weight: 400;\"> And then there were the practical concerns, since Californians were quickly downing what trees \u003c/span>\u003ci>\u003cspan style=\"font-weight: 400;\">were \u003c/span>\u003c/i>\u003cspan style=\"font-weight: 400;\">here.\u003c/span>\u003c/p>\n\u003cp>\u003cb>Jared Farmer: \u003c/b>\u003cspan style=\"font-weight: 400;\">This was course just the era of wood power—wood was used for almost everything. For energy of course but also for building every city, for moving things around, all the things today we use concrete and plastic and steel.\u003c/span>\u003c/p>\n\u003cp>\u003cb>Daniel Potter: \u003c/b>\u003cspan style=\"font-weight: 400;\">So by the 1850s you could buy young eucalyptus in nurseries in San Francisco. It was grown here from seed, which meant it didn’t bring along any of the usual bugs or pathogens it faces back home. The lack of pests made it easy for these trees to grow really tall, really fast.\u003c/span>\u003c/p>\n\u003cp>\u003cb>\u003ci>(Berkeley outdoor ambi)\u003c/i>\u003c/b>\u003c/p>\n\u003cp>\u003cb>Joe McBride:\u003c/b>\u003cspan style=\"font-weight: 400;\"> I would say in an average rainfall year here in California, these trees probably put on four to six feet in height.\u003c/span>\u003c/p>\n\u003cp>\u003cb>Daniel Potter: \u003c/b>\u003cspan style=\"font-weight: 400;\">This is Joe McBride, professor emeritus of landscape architecture and environmental planning at UC Berkeley. I met him in a towering stand of ancient eucalyptus on campus.\u003c/span>\u003c/p>\n\u003cp>\u003cb>Joe McBride: \u003c/b>\u003cspan style=\"font-weight: 400;\">These trees are now over 200 feet tall, and the largest ones are approaching six feet in diameter.\u003c/span>\u003c/p>\n\u003cp>\u003cb>Daniel Potter: \u003c/b>\u003cspan style=\"font-weight: 400;\">Near the present-day Life Sciences building there used to be a cinder running track—picture fine ashen gravel. A hundred and forty years ago \u003c/span>\u003cspan style=\"font-weight: 400;\">…\u003c/span>\u003cspan style=\"font-weight: 400;\"> at a fabled track meet with Stanford … supposedly the wind was so bad it blew cinder in everyone’s faces and the Stanford coach took his team home—track meet \u003c/span>\u003ci>\u003cspan style=\"font-weight: 400;\">over\u003c/span>\u003c/i>\u003cspan style=\"font-weight: 400;\">.\u003c/span>\u003c/p>\n\u003cp>\u003cb>Joe McBride:\u003c/b>\u003cspan style=\"font-weight: 400;\"> As a result of that, the campus planted this grove of eucalyptus trees as a windbreak, to prevent the wind from blowing the cinders into other athletes eyes in the future. This is the largest, densest stand of blue gum eucalyptus in the world.\u003c/span>\u003c/p>\n\u003cp>\u003cb>Olivia Allen-Price: \u003c/b>\u003cspan style=\"font-weight: 400;\">Tell us what that is— blue gum eucalyptus…\u003c/span>\u003c/p>\n\u003cp>\u003cb>Daniel Potter:\u003c/b>\u003cspan style=\"font-weight: 400;\"> So, the genus eucalyptus includes hundreds of species—some more like shrubs than giant trees. A lot were tried out here, but the main one today is Tasmanian blue gum, eucalyptus globulus. Side note: apparently even botanists can’t always tell what species they’re looking at without climbing way up to check out the fruit… \u003c/span>\u003c/p>\n\u003cp>\u003cb>Olivia Allen-Price: \u003c/b>\u003cspan style=\"font-weight: 400;\">So for a time these trees were planted on purpose – but many people came to hate them. What changed?\u003c/span>\u003c/p>\n\u003cp>\u003cb>Jared Farmer:\u003c/b>\u003cspan style=\"font-weight: 400;\"> If you go back to California farm journals of the 1870s, 80s, 90s, there’s report after report of disappointment, like these trees are no good.\u003c/span>\u003c/p>\n\u003cp>\u003cb>Daniel Potter: \u003c/b>\u003cspan style=\"font-weight: 400;\">That’s Jared Farmer, the historian again. It turns out while our blue gum gets tall real fast, it’s not ideal for woodworking—it splits and cracks and doesn’t hold up if you’re making railroad ties. It also sucks up a lot of water, which is handy if you’re trying to drain swampland, but less handy if your well is nearby. People were kinda over it. Until!\u003c/span>\u003c/p>\n\u003cp>\u003cb>Joe McBride: \u003c/b>\u003cspan style=\"font-weight: 400;\">At the turn of the 20\u003c/span>\u003cspan style=\"font-weight: 400;\">th\u003c/span>\u003cspan style=\"font-weight: 400;\"> century, we were faced with a crisis in terms of hardwood forest that had been cut over in the eastern United States.\u003c/span>\u003c/p>\n\u003cp>\u003cb>Daniel Potter: \u003c/b>\u003cspan style=\"font-weight: 400;\">In 1907, the U.S. Forest Service predicted a looming hardwood famine. People thought there was only about a 15-year supply before we ran out of usable forest. That gave eucalyptus boosters an idea: plant now, and fast-growing blue gums could be big enough to harvest once the famine hits.\u003c/span>\u003c/p>\n\u003cp>\u003cb>Joe McBride: \u003c/b>\u003cspan style=\"font-weight: 400;\">Here in the Bay Area, for $100 you could buy an acre of land… planting those trees on 6 by 6 spacing, about 1,200 trees per acre. So they sold lots of these on a speculative basis.\u003c/span>\u003c/p>\n\u003cp>\u003cb>Daniel Potter: \u003c/b>\u003cspan style=\"font-weight: 400;\">This became a frenzy—a bubble. Companies suckered investors with claims like \u003c/span>\u003cb>\u003ci>“\u003c/i>\u003c/b>\u003cspan style=\"font-weight: 400;\">Forests Grown While You Wait” and “Absolute Security and Absolute Certainty.” Within a few years, thousands of acres were bought up and planted with eucalyptus, from Southern California up to Mendocino.\u003c/span>\u003c/p>\n\u003cp>\u003cb>Olivia Allen-Price:\u003c/b>\u003cspan style=\"font-weight: 400;\"> Wait, didn’t we just say blue gum was terrible for woodworking? Why was everyone still planting it?\u003c/span>\u003c/p>\n\u003cp>\u003cb>Daniel Potter:\u003c/b>\u003cspan style=\"font-weight: 400;\"> In his book, Farmer gives a few reasons: blue gum was familiar, seeds were everywhere, it could grow in lousy soil—plus a blend of historical ignorance and artful deception.\u003c/span>\u003c/p>\n\u003cp>\u003cb>Jared Farmer:\u003c/b>\u003cspan style=\"font-weight: 400;\"> In part because these people were not reading farm reports from the 1870s and 1880s, and even if they did read them maybe they wouldn’t care because they just wanted to make a buck, they were just flipping land.\u003c/span>\u003c/p>\n\u003cp>\u003cb>Daniel Potter: \u003c/b>\u003cspan style=\"font-weight: 400;\">Fears of a hardwood famine ultimately proved overblown. Concrete and steel became cheaper, forests further east recovered, and people started making furniture from imported wood like mahogany instead. California’s eucalyptus trees weren’t even worth cutting down—so there they stand. They’re like century-old abandoned crops. Farmer describes their presence here as a beautiful mistake. \u003c/span>\u003c/p>\n\u003cp>\u003cb>Olivia Allen-Price: \u003c/b>\u003cspan style=\"font-weight: 400;\">That brings us to the second half of this week’s question from Julie and Christian:\u003c/span>\u003c/p>\n\u003cp>\u003cb>Julie Bergen: \u003c/b>\u003cspan style=\"font-weight: 400;\">I know that they’re invasive, so what do we do about that?\u003c/span>\u003c/p>\n\u003cp>\u003cb>Christian Wagner: \u003c/b>\u003cspan style=\"font-weight: 400;\">To what extent is it sort of here to stay?\u003c/span>\u003c/p>\n\u003cp>\u003cb>Daniel Potter:\u003c/b>\u003cspan style=\"font-weight: 400;\"> I took this question to Jenn Yost, a botanist at CalPoly. While some people see California’s eucalyptus trees as a heinous invasive species and want them gone, Yost was careful to delineate between \u003c/span>\u003ci>\u003cspan style=\"font-weight: 400;\">non-native\u003c/span>\u003c/i>\u003cspan style=\"font-weight: 400;\">—which these trees definitely are—and \u003c/span>\u003ci>\u003cspan style=\"font-weight: 400;\">invasive\u003c/span>\u003c/i>\u003cspan style=\"font-weight: 400;\">.\u003c/span>\u003c/p>\n\u003cp>\u003cb>Jenn Yost:\u003c/b>\u003cspan style=\"font-weight: 400;\"> Just because something reproduces a little bit, sometimes it doesn’t do it enough where it has an ecological impact. And as soon as it starts outcompeting native species or fundamentally changing the environment so that native species can’t grow there, we would consider that an invasive species.\u003c/span>\u003c/p>\n\u003cp>\u003cb>Daniel Potter: \u003c/b>\u003cspan style=\"font-weight: 400;\">While many kinds of eucalyptus have been tried out in California, only \u003c/span>\u003ci>\u003cspan style=\"font-weight: 400;\">two\u003c/span>\u003c/i>\u003cspan style=\"font-weight: 400;\"> are good enough at reproducing here to be considered \u003c/span>\u003ci>\u003cspan style=\"font-weight: 400;\">invasive\u003c/span>\u003c/i>\u003cspan style=\"font-weight: 400;\">: the red gum and the blue gum. And those don’t seem able to reproduce just \u003c/span>\u003ci>\u003cspan style=\"font-weight: 400;\">anywhere\u003c/span>\u003c/i>\u003cspan style=\"font-weight: 400;\">. In some drier parts of the state, the old plantations aren’t spreading.\u003c/span>\u003c/p>\n\u003cp>\u003cb>Jenn Yost:\u003c/b>\u003cspan style=\"font-weight: 400;\"> You see blue gums being weedy and really reproducing on their own in areas that have summer moisture, and that’s usually in the form of fog. Or you see them being weedy in places with year-round water, like irrigation ditches or places with seeps.\u003c/span>\u003c/p>\n\u003cp>\u003cb>Daniel Potter:\u003c/b>\u003cspan style=\"font-weight: 400;\"> Blue gum is classified as a “moderate invasive.” Compared to other, faster-moving weeds, it’s not California’s most-wanted ravaging the countryside. Yost attributes a lot of the current resentment to the historic 1991 fire in the East Bay hills, where tons of eucalyptus burned.\u003c/span>\u003c/p>\n\u003cp>\u003cb>Jenn Yost:\u003c/b>\u003cspan style=\"font-weight: 400;\"> People at the time I don’t think associated that with a planted plantation; it was just a eucalyptus forest. And then when the fire came through—I mean that fire came through so fast and so hot and so many people lost their homes that it was a natural reaction to hate blue gums at that point.\u003c/span>\u003c/p>\n\u003cp>\u003cb>Archival tape: \u003c/b>\u003cspan style=\"font-weight: 400;\">Pushed by 30 mile per hour winds, fire swept down the Oakland Berkeley hills destroying everything in its path.\u003c/span>\u003c/p>\n\u003cp>\u003cb>Olivia Allen-Price: \u003c/b>\u003cspan style=\"font-weight: 400;\">The East Bay Hills fire was hugely devastating… 25 people died and thousands were left homeless. Many experts say that eucalyptus trees worsen the fire threat for a few reasons… The bark they shed dries out quickly and creates fuel…a lot of fuel. Once a fire starts, that bark easily catches the wind and can be blown miles away, spreading the fire quickly. Also: Eucalyptus trees are really oily. The oil is actually what gives off that intense fragrance they’re known for. But in a fire, that oil also makes them flammable.\u003c/span>\u003c/p>\n\u003cp>\u003cb>Daniel Potter:\u003c/b>\u003cspan style=\"font-weight: 400;\"> Other folks argue different plants in their place would also burn. \u003c/span>\u003cspan style=\"font-weight: 400;\">This is an entrenched debate! A few years ago there was federal fire-prevention funding to cut down trees in those same hills, and people protested. Folks got naked and hugged the blue gums on campus at Berkeley. \u003c/span>\u003c/p>\n\u003cp>\u003cb>Olivia Allen-Price:\u003c/b>\u003cspan style=\"font-weight: 400;\"> But after a nearly decade-long legal battle, a court gave UC Berkeley the go-ahead to cut down dozens of acres of Eucalyptus last year. Still, it’s a drop in the bucket when you think about how many of these trees we have in California.\u003c/span>\u003c/p>\n\u003cp>\u003cb>Daniel Potter: \u003c/b>\u003cspan style=\"font-weight: 400;\">Yost estimates there’s something like 40 thousand acres of unharvested crops in the state. It’s not hard to extrapolate upwards of ten million trees statewide. Cutting each one down takes time and money.\u003c/span>\u003c/p>\n\u003cp>\u003cb>Olivia Allen-Price: \u003c/b>\u003cspan style=\"font-weight: 400;\">So really the question of whether eucalyptus is going away comes down to who’s backyard it’s in. Can they afford to cut the trees down? Is the political will there to do it? \u003c/span>\u003cspan style=\"font-weight: 400;\">\u003cbr>\n\u003c/span>\u003cspan style=\"font-weight: 400;\">\u003cbr>\n\u003c/span>\u003ci>\u003cspan style=\"font-weight: 400;\">Music\u003c/span>\u003c/i>\u003c/p>\n\u003cp>\u003cb>Olivia Allen-Price: \u003c/b>\u003cspan style=\"font-weight: 400;\">So that’s where things are. What did our question askers think? Christian and Julie.\u003c/span>\u003c/p>\n\u003cp>\u003cb>Julie Bergen:\u003c/b> \u003cspan style=\"font-weight: 400;\">That was absolutely fascinating. I did not know that the history was even that rich.\u003cbr>\n\u003c/span>\u003cspan style=\"font-weight: 400;\">\u003cbr>\n\u003c/span>\u003cb>Christian Wagner: \u003c/b>\u003cspan style=\"font-weight: 400;\">I have to say I love the idea that a lot of what we see was a get-rich-quick scheme. Because that is just a theme that happens so often in America and in California.\u003c/span>\u003c/p>\n\u003cp>\u003cb>Olivia Allen-Price: \u003c/b>\u003cspan style=\"font-weight: 400;\">So often to our detriment. Science Writer Daniel Potter, thanks for stomping around so many forests for us this week. \u003c/span>\u003c/p>\n\u003cp>\u003cb>Daniel Potter: \u003c/b>\u003cspan style=\"font-weight: 400;\">Happy to do it!\u003c/span>\u003c/p>\n\u003cp>\u003ci>\u003cspan style=\"font-weight: 400;\">music\u003c/span>\u003c/i>\u003cspan style=\"font-weight: 400;\">\u003cbr>\n\u003c/span>\u003cspan style=\"font-weight: 400;\">\u003cbr>\n\u003c/span>\u003cb>Olivia Allen-Price: \u003c/b>\u003cspan style=\"font-weight: 400;\">A note: A few of the sources quoted in his story have changed jobs since they were first interviewed in 2018.\u003c/span>\u003c/p>\n\u003cp>\u003cb>Olivia Allen-Price: \u003c/b>\u003cspan style=\"font-weight: 400;\">If you’ve ever wondered what all goes into making a Bay Curious story sound the way it does … join producer Katrina Schwartz and I TONIGHT, April 11 for our talk: Elevating Audio Stories with Sound for the PRX Podcast Garage. We’ll be talking through how we use music, sound effects, archival material, narration and more to bring the Bay Curious podcast to life. Join us in person at KQED’s Headquarters, or on the livestream. Tickets are free if you use the code “baycurious.” Grab yours at \u003c/span>\u003ca href=\"http://kqed.org/podcast\">\u003cspan style=\"font-weight: 400;\">kqed.org/podcastgarage\u003c/span>\u003c/a>\u003c/p>\n\u003cp>\u003cb>Olivia Allen-Price: \u003c/b>\u003cspan style=\"font-weight: 400;\">Bay Curious is made by Katrina Schwartz, Christopher Beale, and me, Olivia-Allen Price. Additional support from Jen Chien, Katie Sprenger, Cesar Saldana, Maha Sanad, Holly Kernan and the whole KQED Family. \u003c/span>\u003c/p>\n\u003cp>\u003cb>Christian Wagner:\u003c/b>\u003cspan style=\"font-weight: 400;\"> Bay Curious is made in San Francisco at KQED. \u003c/span>\u003c/p>\n\u003cp>\u003c/p>\u003c/div>","attributes":{"named":{},"numeric":[]}},{"type":"component","content":"","name":"ad","attributes":{"named":{"label":"floatright"},"numeric":["floatright"]}},{"type":"contentString","content":"\u003cdiv class=\"post-body\">\u003cp>\u003c/p>\n\u003cp>\u003cb>Olivia Allen-Price: \u003c/b>\u003cspan style=\"font-weight: 400;\">I’m Olivia Allen-Price. Have a great week!\u003c/span>\u003c/p>\n\n\u003c/div>\u003c/p>","attributes":{"named":{},"numeric":[]}}],"link":"/news/11644927/eucalyptus-how-californias-most-hated-tree-took-root-2","authors":["byline_news_11644927"],"programs":["news_33523","news_6944"],"series":["news_17986"],"categories":["news_19906","news_33520","news_356"],"tags":["news_20023"],"featImg":"news_11647129","label":"source_news_11644927"},"news_10779164":{"type":"posts","id":"news_10779164","meta":{"index":"posts_1591205157","site":"news","id":"10779164","score":null,"sort":[1633600807000]},"guestAuthors":[],"slug":"why-are-so-many-dead-people-in-colma-and-so-few-in-san-francisco","title":"Why Are There So Many Graves in Colma? And So Few in San Francisco?","publishDate":1633600807,"format":"standard","headTitle":"Why Are There So Many Graves in Colma? And So Few in San Francisco? | KQED","labelTerm":{},"content":"\u003cp>\u003cem>This article was originally published Oct. 26, 2017. \u003c/em>\u003c/p>\n\u003cp>When you drive around the tiny town of Colma, just south of Daly City, you can’t help but notice a certain redundancy of scenery.\u003c/p>\n\u003cp>Tombstones. A florist …\u003c/p>\n\u003cp>More tombstones … another florist.\u003c/p>\n\u003cp>What Las Vegas is to gambling, Colma is to death.\u003c/p>\n\u003cp>[ad fullwidth]\u003c/p>\n\u003cp>Nearly three-quarters of the 2.2-square-mile town is zoned for cemeteries — of which there are 17.\u003c/p>\n\u003cp>Colma is the last place you want to be when the zombie apocalypse goes down.\u003c/p>\n\u003cp>[baycuriouspodcastinfo]\u003c/p>\n\u003cp>The town’s population is 1,431, says Pat Hatfield of the local historical association.\u003c/p>\n\u003cp>“Of the living …,” I clarify.\u003c/p>\n\u003cp>She nods. “Above-ground residents, we call them. Maybe a million and a half underground, so we’re a little bit outgunned.”\u003c/p>\n\u003cfigure id=\"attachment_10795849\" class=\"wp-caption alignright\" style=\"max-width: 800px\">\u003ca href=\"http://ww2.kqed.org/news/wp-content/uploads/sites/10/2026/12/V0A9321.jpg\" rel=\"attachment wp-att-10795849\">\u003cimg decoding=\"async\" loading=\"lazy\" class=\"size-medium wp-image-10795849\" src=\"http://ww2.kqed.org/news/wp-content/uploads/sites/10/2026/12/V0A9321-800x533.jpg\" alt=\"In many parts of Colma, neat rows of gravestones are visible for as far as the eye can see.\" width=\"800\" height=\"533\" srcset=\"https://ww2.kqed.org/app/uploads/sites/10/2026/12/V0A9321-800x533.jpg 800w, https://ww2.kqed.org/app/uploads/sites/10/2026/12/V0A9321-400x267.jpg 400w, https://ww2.kqed.org/app/uploads/sites/10/2026/12/V0A9321-768x512.jpg 768w, https://ww2.kqed.org/app/uploads/sites/10/2026/12/V0A9321-1440x960.jpg 1440w, https://ww2.kqed.org/app/uploads/sites/10/2026/12/V0A9321-1920x1280.jpg 1920w, https://ww2.kqed.org/app/uploads/sites/10/2026/12/V0A9321-1180x787.jpg 1180w, https://ww2.kqed.org/app/uploads/sites/10/2026/12/V0A9321-960x640.jpg 960w\" sizes=\"(max-width: 800px) 100vw, 800px\">\u003c/a>\u003cfigcaption class=\"wp-caption-text\">In many parts of Colma, neat rows of gravestones are visible for as far as the eye can see. \u003ccite>(Olivia Allen-Price/KQED)\u003c/cite>\u003c/figcaption>\u003c/figure>\n\u003cp>The association’s headquarters sits quietly between two cemeteries. It doubles as a museum, with binders on display for each of the town’s final resting places. Flip through and your eye catches on bold-letter names like Joe DiMaggio and William Randolph Hearst. When death got the drop on Wyatt Earp, the legendary Old West lawman was buried in Hills of Eternity Memorial Park, a Jewish cemetery. (\u003ca href=\"http://www.neatorama.com/2011/11/16/why-wyatt-earp-is-buried-in-a-jewish-cemetery/\" target=\"_blank\" rel=\"noopener noreferrer\">Here’s why\u003c/a>.)\u003c/p>\n\u003cp>On the other hand, if you want to browse graves in San Francisco, your choices are limited.\u003c/p>\n\u003cp>There’s \u003ca href=\"http://www.cem.va.gov/cems/nchp/sanfrancisco.asp\" target=\"_blank\" rel=\"noopener noreferrer\">San Francisco National Cemetery\u003c/a> in the Presidio, but that’s technically on federal land.\u003c/p>\n\u003cp>The lone cemetery in the city proper is at \u003ca href=\"http://cemeterytravel.com/2011/04/27/cemetery-of-the-week-13-mission-dolores-cemetery/\" target=\"_blank\" rel=\"noopener noreferrer\">Mission Dolores\u003c/a>. But the cemetery is just one-sixth its original size, says Andrew Galvan, the Mission Dolores curator. Eleven thousand dead people were buried there from 1782 to 1898.\u003c/p>\n\u003cp>All right. That accounts for thousands of expired locals.\u003c/p>\n\u003cp>Where’s everybody else?\u003c/p>\n\u003ch3>San Francisco Graveyards of the Past\u003c/h3>\n\u003cp>San Francisco was once \u003ca href=\"http://www.sanfranciscocemeteries.com/\" target=\"_blank\" rel=\"noopener noreferrer\">full of cemeteries\u003c/a>.\u003c/p>\n\u003cp>“In the Gold Rush days they decided to build cemeteries in the western part of the city, where nobody would ever want to live,” says Michael Svanevik, a San Mateo County historian who’s the go-to guy on this topic.\u003c/p>\n\u003cp>Four huge cemeteries — Laurel Hill, Calvary, the Independent Order of Odd Fellows and the Masonic Cemetery — were established on land the University of San Francisco occupies today. These cemeteries took up between 60 and 70 square blocks. Golden Gate Cemetery, out by Lands End, took up a similar swath of space.\u003c/p>\n\u003cfigure id=\"attachment_10785902\" class=\"wp-caption aligncenter\" style=\"max-width: 720px\">\u003ca href=\"http://www.davidrumsey.com/luna/servlet/view/search?QuickSearchA=QuickSearchA&q=san+francisco+cemeteries&sort=pub_list_no_initialsort%2Cpub_list_no_initialsort%2Cpub_list_no_initialsort%2Cpub_date&search=Search\">\u003cimg decoding=\"async\" loading=\"lazy\" class=\"wp-image-10785902\" src=\"http://ww2.kqed.org/news/wp-content/uploads/sites/10/2015/12/Cemetery-map-highlighted_1873.jpg\" alt=\"Cemetery-map-highlighted_1873\" width=\"720\" height=\"513\" srcset=\"https://ww2.kqed.org/app/uploads/sites/10/2015/12/Cemetery-map-highlighted_1873.jpg 720w, https://ww2.kqed.org/app/uploads/sites/10/2015/12/Cemetery-map-highlighted_1873-400x285.jpg 400w\" sizes=\"(max-width: 720px) 100vw, 720px\">\u003c/a>\u003cfigcaption class=\"wp-caption-text\">An 1873 map shows the ‘Big Four’ cemeteries in San Francisco. (David Rumsey Map Collection) \u003ccite>(David Rumsey Historical Map Collection)\u003c/cite>\u003c/figcaption>\u003c/figure>\n\u003cp>As San Francisco’s population rapidly grew, homes were built on all sides of the cemetery complex. Streetcars had to navigate around these islands of the dead to transport residents to work and back.\u003c/p>\n\u003cp>“This now became very valuable land, and people turned against the cemeteries,” Svanevik says.\u003c/p>\n\u003cp>Just when you think the living have a hard time holding onto their place in San Francisco, imagine how the \u003cem>dead\u003c/em> fared.\u003c/p>\n\u003cfigure id=\"attachment_10787031\" class=\"wp-caption aligncenter\" style=\"max-width: 640px\">\u003ca href=\"http://ww2.kqed.org/news/wp-content/uploads/sites/10/2015/12/San-Francisco-Golden-Gate-Cemetery.png\" rel=\"attachment wp-att-10787031\">\u003cimg decoding=\"async\" loading=\"lazy\" class=\"wp-image-10787031 size-large\" src=\"http://ww2.kqed.org/news/wp-content/uploads/sites/10/2026/12/00944023-1440x879.jpg\" alt=\"Golden Gate, or City Cemetery, shown in an 1876 map by William P. Humphreys & Co.\" width=\"640\" height=\"391\" srcset=\"https://ww2.kqed.org/app/uploads/sites/10/2026/12/00944023-1440x879.jpg 1440w, https://ww2.kqed.org/app/uploads/sites/10/2026/12/00944023-400x244.jpg 400w, https://ww2.kqed.org/app/uploads/sites/10/2026/12/00944023-800x489.jpg 800w, https://ww2.kqed.org/app/uploads/sites/10/2026/12/00944023-1180x721.jpg 1180w, https://ww2.kqed.org/app/uploads/sites/10/2026/12/00944023-960x586.jpg 960w, https://ww2.kqed.org/app/uploads/sites/10/2026/12/00944023.jpg 1536w\" sizes=\"(max-width: 640px) 100vw, 640px\">\u003c/a>\u003cfigcaption class=\"wp-caption-text\">Golden Gate, or City Cemetery, shown in an 1876 map by William P. Humphreys & Co. (David Rumsey Map Collection) \u003ccite>(David Rumsey Historical Map Collection)\u003c/cite>\u003c/figcaption>\u003c/figure>\n\u003ch3>Public Opinion Turns\u003c/h3>\n\u003cp>By 1880, San Franciscans had grown disenchanted with its burgeoning population of dead folks.\u003c/p>\n\u003cp>Headlines like “Cemeteries must go!” began to show up in local newspapers, and residents became concerned over hysterical claims about health hazards.\u003c/p>\n\u003cp>“Scientists warned that throat maladies constantly assume a malignant type … when the patients are exposed to a wind that blows from a crowded cemetery,” wrote Svanevik and co-author Shirley Burgett in their book “\u003ca href=\"https://books.google.com/books?id=A_AXAQAAMAAJ&q=city+of+souls+colma&dq=city+of+souls+colma&hl=en&sa=X&ved=0ahUKEwjWhai10srJAhUBUmMKHS-cAc4Q6AEIHDAA\" target=\"_blank\" rel=\"noopener noreferrer\">City of Souls\u003c/a>.”\u003c/p>\n\u003cp>In 1901, San Francisco banned any new burials within city limits, part of what Svanevik and Burgett call a relentless assault on the city’s “belt of death.” For several decades, what to do with the cemeteries was a hot-button issue.\u003c/p>\n\u003cfigure id=\"attachment_10795858\" class=\"wp-caption alignright\" style=\"max-width: 800px\">\u003ca href=\"http://ww2.kqed.org/news/wp-content/uploads/sites/10/2026/12/lonehill.jpg\" rel=\"attachment wp-att-10795858\">\u003cimg decoding=\"async\" loading=\"lazy\" class=\"wp-image-10795858 size-medium\" src=\"http://ww2.kqed.org/news/wp-content/uploads/sites/10/2026/12/lonehill-800x606.jpg\" alt=\"With no endowments to pay for upkeep, cemeteries like Laurel Hill pictured here, fell into ruin. (Colma Historical Association)\" width=\"800\" height=\"606\" srcset=\"https://ww2.kqed.org/app/uploads/sites/10/2026/12/lonehill-800x606.jpg 800w, https://ww2.kqed.org/app/uploads/sites/10/2026/12/lonehill-400x303.jpg 400w, https://ww2.kqed.org/app/uploads/sites/10/2026/12/lonehill-768x582.jpg 768w, https://ww2.kqed.org/app/uploads/sites/10/2026/12/lonehill-1440x1091.jpg 1440w, https://ww2.kqed.org/app/uploads/sites/10/2026/12/lonehill-1920x1454.jpg 1920w, https://ww2.kqed.org/app/uploads/sites/10/2026/12/lonehill-1180x894.jpg 1180w, https://ww2.kqed.org/app/uploads/sites/10/2026/12/lonehill-960x727.jpg 960w\" sizes=\"(max-width: 800px) 100vw, 800px\">\u003c/a>\u003cfigcaption class=\"wp-caption-text\">With no endowments to pay for upkeep, cemeteries like Laurel Hill, pictured here, fell into ruin. (Colma Historical Association) \u003ccite>(CREDIT)\u003c/cite>\u003c/figcaption>\u003c/figure>\n\u003cp>Those who coveted valuable graveyard land could rely on at least one legitimate talking point: The cemeteries had become a real mess.\u003c/p>\n\u003cp>After San Francisco ended new burials, there was no money to care for existing cemetery grounds, and many graveyards fell into ruin. Statues and gravestones were toppled. The valuable bronze doors on private mausoleums were stolen. People would reportedly wander in and get drunk, or have late-night sex orgies.\u003c/p>\n\u003cp>“Entire skeletons were carried away to be used as Halloween decorations,” says Svanevik.\u003c/p>\n\u003cp>He’s even met people who report playing soccer with skulls.\u003c/p>\n\u003ch3>Colma: The Incorporation\u003c/h3>\n\u003cp>The first to move out of San Francisco were two Jewish cemeteries, Hills of Eternity and Home of Peace. In the 1880s, they abandoned the plots of land that now make up Dolores Park for the open farm area of Colma. A few years later, the San Francisco Archdiocese, running out of room in San Francisco, established Colma’s Holy Cross Cemetery.\u003c/p>\n\u003cp>As space for San Francisco burials grew tighter, more of San Francisco’s cemetery associations looked south, purchasing large plots of Colma’s farmland.\u003c/p>\n\u003cfigure id=\"attachment_10787086\" class=\"wp-caption aligncenter\" style=\"max-width: 640px\">\u003ca href=\"http://ww2.kqed.org/news/wp-content/uploads/sites/10/2015/12/San-Francisco-Jewish-Cemeteries.png\" rel=\"attachment wp-att-10787086\">\u003cimg decoding=\"async\" loading=\"lazy\" class=\"wp-image-10787086 size-large\" src=\"http://ww2.kqed.org/news/wp-content/uploads/sites/10/2026/12/Jewish-cemeteries-lg-1440x875.jpg\" alt=\"Until the 1880s, two Jewish cemeteries stood where Dolores Park is today. (Colma Historical Association)\" width=\"640\" height=\"389\" srcset=\"https://ww2.kqed.org/app/uploads/sites/10/2026/12/Jewish-cemeteries-lg-1440x875.jpg 1440w, https://ww2.kqed.org/app/uploads/sites/10/2026/12/Jewish-cemeteries-lg-400x243.jpg 400w, https://ww2.kqed.org/app/uploads/sites/10/2026/12/Jewish-cemeteries-lg-800x486.jpg 800w, https://ww2.kqed.org/app/uploads/sites/10/2026/12/Jewish-cemeteries-lg-1180x717.jpg 1180w, https://ww2.kqed.org/app/uploads/sites/10/2026/12/Jewish-cemeteries-lg-960x583.jpg 960w, https://ww2.kqed.org/app/uploads/sites/10/2026/12/Jewish-cemeteries-lg.jpg 1536w\" sizes=\"(max-width: 640px) 100vw, 640px\">\u003c/a>\u003cfigcaption class=\"wp-caption-text\">Until the 1880s, two Jewish cemeteries stood where Dolores Park is today. (Colma Historical Association) \u003ccite>(David Rumsey Historical Map Collection)\u003c/cite>\u003c/figcaption>\u003c/figure>\n\u003cp>In 1924, 14 cemetery associations incorporated the town of Lawndale (Colma’s original name). It is the only city incorporated for the sole purpose of preserving and protecting the dead, says the historical association’s Pat Hatfield.\u003c/p>\n\u003cp>The founders had good reason to be explicit about the new town’s purpose. After all, many of the remains that came to Colma had been moved several times. A body could have first been buried in the Gold Rush cemetery, only to be moved to Yerba Buena Cemetery, on to City Cemetery by the Legion of Honor, and finally to the cemetery complex where USF now stands.\u003c/p>\n\u003cp>“They didn’t want living people in Colma,” says Svanevik. “Every time somebody came forth and wanted to open a store, the town council voted it down, unless it was a floral shop or something associated with a cemetery.”\u003c/p>\n\u003ch3>San Francisco: And Then There Were Five\u003c/h3>\n\u003cp>By the 1920s, the only San Francisco cemeteries remaining were the so-called Big Four as well as the one at Mission Dolores. In the face of public hostility, the Odd Fellows and Masonic cemeteries agreed to move to Colma, but 17 families went to federal court to block the Masonic move. Those bodies were transferred only after sale of the land was approved in a 1930 Supreme Court ruling.\u003c/p>\n\u003cfigure id=\"attachment_10795864\" class=\"wp-caption aligncenter\" style=\"max-width: 800px\">\u003ca href=\"http://ww2.kqed.org/news/wp-content/uploads/sites/10/2026/12/calvary.jpg\" rel=\"attachment wp-att-10795864\">\u003cimg decoding=\"async\" loading=\"lazy\" class=\"wp-image-10795864 size-medium\" src=\"http://ww2.kqed.org/news/wp-content/uploads/sites/10/2026/12/calvary-800x508.jpg\" alt=\"Calvary cemetery from above in the 1930s. (Colma Historical Association)\" width=\"800\" height=\"508\" srcset=\"https://ww2.kqed.org/app/uploads/sites/10/2026/12/calvary-800x508.jpg 800w, https://ww2.kqed.org/app/uploads/sites/10/2026/12/calvary-400x254.jpg 400w, https://ww2.kqed.org/app/uploads/sites/10/2026/12/calvary-768x488.jpg 768w, https://ww2.kqed.org/app/uploads/sites/10/2026/12/calvary-1440x915.jpg 1440w, https://ww2.kqed.org/app/uploads/sites/10/2026/12/calvary-1920x1220.jpg 1920w, https://ww2.kqed.org/app/uploads/sites/10/2026/12/calvary-1180x750.jpg 1180w, https://ww2.kqed.org/app/uploads/sites/10/2026/12/calvary-960x610.jpg 960w\" sizes=\"(max-width: 800px) 100vw, 800px\">\u003c/a>\u003cfigcaption class=\"wp-caption-text\">Calvary Cemetery from above in the 1930s. (Colma Historical Association) \u003ccite>(San Francisco Public Library)\u003c/cite>\u003c/figcaption>\u003c/figure>\n\u003cp>The Catholic Church successfully made the case that the Mission Dolores cemetery should be allowed to stay for historical reasons. Andrew Galvan of Mission Dolores says just 60 bodies were moved to Colma between 1930 and 1932.\u003c/p>\n\u003cp>The Catholic Church also balked at uprooting Calvary Cemetery. The archdiocese didn’t like the idea of giving future plot owners in other cemeteries the idea that nothing is sacred or permanent — not even the place where you are laid to rest.\u003c/p>\n\u003cp>But eventually they relented, which left one cemetery — Laurel Hill. The rectangle of graves \u003ca href=\"http://www.sanfranciscocemeteries.com/laurelmap.html\" target=\"_blank\" rel=\"noopener noreferrer\">bounded by California, Geary, Parker and Presidio streets\u003c/a> was the lone holdout.\u003c/p>\n\u003caside class=\"alignleft\">\n\u003ch2>More on Colma\u003c/h2>\n\u003cp>\u003ca href=\"http://ww2.kqed.org/news/2015/12/16/is-colma-actually-shaped-like-an-angel\" target=\"_blank\" rel=\"noopener noreferrer\">\u003cimg decoding=\"async\" src=\"http://u.s.kqed.net/2015/12/16/colmaoutline.jpg\" alt=\"\">\u003c/a>\u003c/p>\n\u003ch3>Is Colma Shaped Like an Angel? Or Daemon?\u003c/h3>\n\u003cp>\u003ca href=\"http://ww2.kqed.org/news/2015/12/16/growing-up-in-colma\" target=\"_blank\" rel=\"noopener noreferrer\">\u003cimg decoding=\"async\" src=\"http://u.s.kqed.net/2015/12/16/smallcemetery.jpg\" alt=\"\">\u003c/a>\u003c/p>\n\u003ch3>What’s It Like to Grow Up in Colma?\u003c/h3>\n\u003cp> \u003c/p>\n\u003c/aside>\n\u003cp>Anti-cemetery activists made three unsuccessful attempts at ridding the city of Laurel Hill by putting the issue before voters.\u003c/p>\n\u003cp>In 1937 they \u003ca href=\"http://sfpl.org/pdf/main/gic/elections/November2_1937.pdf\" target=\"_blank\" rel=\"noopener noreferrer\">tried once more\u003c/a>. \u003cspan class=\"s1\">The official argument against the measure alluded to the many notable pioneers buried in the cemetery. “Gratitude and common decency should permit these dead to rest in honored peace,” it said.\u003c/span>\u003c/p>\n\u003cp class=\"p1\">\u003cspan class=\"s1\">On the pro-eviction side, proponents included photos of the decrepit graveyard marred by tumbled tombstones, above captions such as “Is this ‘respect for our dead’?” \u003c/span>\u003c/p>\n\u003cp class=\"p1\">This time, the measure to evict passed.\u003c/p>\n\u003ch3>Removing the Bodies\u003c/h3>\n\u003cp>Exhumation and transportation of the bodies was a very sophisticated operation.\u003c/p>\n\u003cp>If the casket was in good shape, they moved it with the body. If the casket had deteriorated, the bones were placed in boxes. Remains were required to be brought by hearse on the same day as exhumation, says Svanevik. The Catholic Church also required a priest to witness the exhumation of any bodies from Calvary Cemetery.\u003c/p>\n\u003cp>“Condition of remains disinterred varied from ‘dust’ to almost perfectly embalmed bodies, the latter resulting from filling of cast-iron caskets with groundwater acting as a preservative,” wrote William Proctor, in a 1950 \u003ca href=\"http://www.sfgenealogy.com/sf/history/hcmcpr.htm\" target=\"_blank\" rel=\"noopener noreferrer\">San Francisco Department of City Planning report\u003c/a>. “The smell of death was often present, even though the remains had been laid to rest from thirty to seventy years previously,” the head of the disinterment told Proctor.\u003c/p>\n\u003cfigure id=\"attachment_10795860\" class=\"wp-caption aligncenter\" style=\"max-width: 3723px\">\u003ca href=\"http://ww2.kqed.org/news/wp-content/uploads/sites/10/2026/12/oddfellows.jpg\" rel=\"attachment wp-att-10795860\">\u003cimg decoding=\"async\" loading=\"lazy\" class=\"wp-image-10795860 size-full\" src=\"http://ww2.kqed.org/news/wp-content/uploads/sites/10/2026/12/oddfellows.jpg\" alt=\"Workers remove bodies from the Odd Fellows cemetery. (Colma Historical Association)\" width=\"3723\" height=\"1578\" srcset=\"https://ww2.kqed.org/app/uploads/sites/10/2026/12/oddfellows.jpg 3723w, https://ww2.kqed.org/app/uploads/sites/10/2026/12/oddfellows-400x170.jpg 400w, https://ww2.kqed.org/app/uploads/sites/10/2026/12/oddfellows-800x339.jpg 800w, https://ww2.kqed.org/app/uploads/sites/10/2026/12/oddfellows-768x326.jpg 768w, https://ww2.kqed.org/app/uploads/sites/10/2026/12/oddfellows-1440x610.jpg 1440w, https://ww2.kqed.org/app/uploads/sites/10/2026/12/oddfellows-1920x814.jpg 1920w, https://ww2.kqed.org/app/uploads/sites/10/2026/12/oddfellows-1180x500.jpg 1180w, https://ww2.kqed.org/app/uploads/sites/10/2026/12/oddfellows-960x407.jpg 960w\" sizes=\"(max-width: 3723px) 100vw, 3723px\">\u003c/a>\u003cfigcaption class=\"wp-caption-text\">Workers remove bodies from the Odd Fellows Cemetery. (Colma Historical Association)\u003c/figcaption>\u003c/figure>\n\u003cp>About 130,000 bodies were disinterred from the “Big Four” cemeteries and moved to Colma. Most were reburied in mass graves, with a single monument to mark their presence.\u003c/p>\n\u003cp>For the 55,000 Catholic pioneers who were moved from San Francisco to Holy Cross in Colma, no marker identified them at their new resting place until 1993.\u003c/p>\n\u003ch3>Where the Tombstones Went\u003c/h3>\n\u003cp>When the San Francisco cemeteries were moved, the bodies were transported for free, but survivors had to pay if they wanted to keep the tombstones. Many survivors couldn’t be found, and the majority of tombstones did not make the trip to Colma. Instead, they were sold for a few pennies each to be used in public works, says Svanevik.\u003c/p>\n\u003cp>Some lined the gutters, which you can \u003ca href=\"http://www.thebolditalic.com/articles/4840-the-gutters-in-buena-vista-park-are-made-out-of-old-headstones\" target=\"_blank\" rel=\"noopener noreferrer\">still see\u003c/a>, in San Francisco’s Buena Vista Park. Others were spread around the city.\u003c/p>\n\u003cp>“Priceless crypts, tombs and private mausoleums were unceremoniously dumped in San Francisco Bay to create breakwaters at Aquatic Park and Saint Francis yacht club,” wrote Svanevik and Burgett in “City of Souls.”\u003c/p>\n\u003cp>And discarded tombstones were used to build a seawall along the Great Highway. They still resurface from time to time, as they did \u003ca href=\"http://www.sfgate.com/bayarea/article/Tombstones-from-long-ago-surfacing-on-S-F-beach-3618805.php\" target=\"_blank\" rel=\"noopener noreferrer\">in 2012 at Ocean Beach.\u003c/a>\u003c/p>\n\u003ch3>Some Left Behind\u003c/h3>\n\u003cp>“They missed a lot of the bodies,” says Alan Ziajka, the University of San Francisco’s official historian, speaking of the mass transfer to Colma. “No one knew that until 1950, when we put up our first major building after the Depression.”\u003c/p>\n\u003cp>That was \u003ca href=\"https://www.usfca.edu/virtual-tour/main-campus/gleeson-library\" target=\"_blank\" rel=\"noopener noreferrer\">Gleeson Library\u003c/a>, which like much of the university was built over what was once Masonic Cemetery. At least 200 bodies were found during excavations, when a backhoe churned up a whole mausoleum. Since then, every time a major excavation has occurred on campus, remains have been found.\u003c/p>\n\u003cp>A work crew breaking ground on the \u003ca href=\"https://www.usfca.edu/housing/residence-halls/hayes-healy\" target=\"_blank\" rel=\"noopener noreferrer\">Hayes-Healy residence hall\u003c/a> in 1966 “came upon so many bones and skulls that they refused to continue working until the human remains were moved from the site,” Ziajka wrote in his book, “Lighting the City, Changing the World, a History of the Sciences at the University of San Francisco.”\u003c/p>\n\u003cp>In 2011, when excavations began for the university’s \u003ca href=\"https://www.usfca.edu/virtual-tour/main-campus/lo-schiavo\" target=\"_blank\" rel=\"noopener noreferrer\">John Lo Schiavo, S.J. Center for Science and Innovation\u003c/a>, roughly 55 coffins, 29 skeletons and several skulls were unearthed.\u003c/p>\n\u003ch3>Legion of Honor: Where Bodies are Buried\u003c/h3>\n\u003cp>One of the most startling cemetery discoveries came in 1993, when the Legion of Honor was undergoing seismic renovation. As the dig began, about 750 bodies were discovered from the \u003ca href=\"http://www.sfgenealogy.com/sf/history/hcmcit.htm\" target=\"_blank\" rel=\"noopener noreferrer\">Golden Gate Cemetery\u003c/a>, also called City Cemetery, which was used from 1868 to 1909. About 18,000 people were buried there.\u003c/p>\n\u003cfigure class=\"wp-caption aligncenter\" style=\"max-width: 1718px\">\u003cimg decoding=\"async\" loading=\"lazy\" src=\"http://www.sfgenealogy.com/sf/history/hcmcitmap2.jpg\" alt=\"null\" width=\"1718\" height=\"1706\">\u003cfigcaption class=\"wp-caption-text\">A diagram of where human remains were found during a seismic renovation at the Legion of Honor in 1993. ( From ‘Health and Disease in 19th Century San Francisco,’ published in Historical Archaeology, 2005.)\u003c/figcaption>\u003c/figure>\n\u003cp>The \u003ca href=\"http://articles.latimes.com/1993-11-12/news/mn-56166_1_san-francisco-history\" target=\"_blank\" rel=\"noopener noreferrer\">L.A. Times reported\u003c/a> that remains included “a man who had a third arm buried with him, several medical-school cadavers and two coffins containing remnants of \u003ca href=\"http://www.history.com/this-day-in-history/levi-strauss-and-jacob-davis-receive-patent-for-blue-jeans\" target=\"_blank\" rel=\"noopener noreferrer\">denim with rivets stamped \u003c/a>\u003ci>\u003ca href=\"http://www.history.com/this-day-in-history/levi-strauss-and-jacob-davis-receive-patent-for-blue-jeans\" target=\"_blank\" rel=\"noopener noreferrer\">Levi\u003c/a>.”\u003c/i>\u003c/p>\n\u003cp>One person who got a close-up look at the Legion of Honor remains was photographer Richard Barnes. His \u003ca href=\"http://www.richardbarnes.net/still-rooms/\" target=\"_blank\" rel=\"noopener noreferrer\">exhibit on the discovery \u003c/a>has traveled around the country.\u003c/p>\n\u003cp>“I think the juxtaposition with the grand temple of art is pretty interesting,” Barnes says. “The idea of preservation of the past and what that represents. Whose past is honored and secured and whose is expendable?”\u003c/p>\n\u003cp>Barnes told \u003ca href=\"http://www.sfweekly.com/sanfrancisco/history-of-the-dead/Content?oid=2134634\" target=\"_blank\" rel=\"noopener noreferrer\">SF Weekly\u003c/a> in 1997 that the original Legion of Honor contractors, working in the early 1920s, “just plowed through burial sites, and plumbers laid pipes right through bodies and skeletons.”\u003c/p>\n\u003cp>“They threw headstones off the cliff into the ocean,” he says.\u003c/p>\n\u003cfigure id=\"attachment_10789711\" class=\"wp-caption aligncenter\" style=\"max-width: 750px\">\u003ca href=\"http://ww2.kqed.org/news/2015/12/16/why-are-so-many-dead-people-in-colma-and-so-few-in-san-francisco/stillrooms_008\" rel=\"attachment wp-att-10789711\">\u003cimg decoding=\"async\" loading=\"lazy\" class=\"wp-image-10789711 size-full\" src=\"http://ww2.kqed.org/news/wp-content/uploads/sites/10/2026/12/stillrooms_008.jpg\" alt='From the Richard Barnes exhibit \"Still Rooms & Excavations\" (Richard Barnes)' width=\"750\" height=\"571\" srcset=\"https://ww2.kqed.org/app/uploads/sites/10/2026/12/stillrooms_008.jpg 750w, https://ww2.kqed.org/app/uploads/sites/10/2026/12/stillrooms_008-400x305.jpg 400w\" sizes=\"(max-width: 750px) 100vw, 750px\">\u003c/a>\u003cfigcaption class=\"wp-caption-text\">From the Richard Barnes exhibit ‘Still Rooms & Excavations’ (Richard Barnes)\u003c/figcaption>\u003c/figure>\n\u003cfigure id=\"attachment_10789712\" class=\"wp-caption aligncenter\" style=\"max-width: 750px\">\u003ca href=\"http://ww2.kqed.org/news/2015/12/16/why-are-so-many-dead-people-in-colma-and-so-few-in-san-francisco/stillrooms_009\" rel=\"attachment wp-att-10789712\">\u003cimg decoding=\"async\" loading=\"lazy\" class=\"wp-image-10789712 size-full\" src=\"http://ww2.kqed.org/news/wp-content/uploads/sites/10/2026/12/stillrooms_009.jpg\" alt='Remains found during renovation at the Legion of Honor in San Francisco, 1993. From the Richard Barnes exhibit \"Still Rooms & Excavations.\" (Colma Historical Association)' width=\"750\" height=\"591\" srcset=\"https://ww2.kqed.org/app/uploads/sites/10/2026/12/stillrooms_009.jpg 750w, https://ww2.kqed.org/app/uploads/sites/10/2026/12/stillrooms_009-400x315.jpg 400w\" sizes=\"(max-width: 750px) 100vw, 750px\">\u003c/a>\u003cfigcaption class=\"wp-caption-text\">Remains found during renovation at the Legion of Honor in San Francisco, 1993. From the Richard Barnes exhibit ‘Still Rooms & Excavations.’ (Colma Historical Association)\u003c/figcaption>\u003c/figure>\n\u003cp>The Lincoln Park Golf Course was also built where Golden Gate Cemetery once stood.\u003c/p>\n\u003cp>From the \u003ca href=\"https://sites.google.com/site/lincolnparkgolfclub/History-of-Lincoln-Park\" target=\"_blank\" rel=\"noopener noreferrer\"> course’s website\u003c/a>:\u003c/p>\n\u003cblockquote>\u003cp>“What is presently the eighteenth fairway of the golf course was a burial ground, primarily for the city’s Italian community. The area that now constitutes the first and thirteenth fairway was the Chinese section of the cemetery and the high terrain at the fifteen fairway and thirteenth tee was a Serbian resting place.”\u003c/p>\u003c/blockquote>\n\u003ch3>Can It Happen Again?\u003c/h3>\n\u003cp>Some find the odyssey of San Francisco’s dead prior to the 20th century unnerving. Who knew that after you die, your body could be so peripatetic?\u003c/p>\n\u003cp>San Francisco is a testament to the reality that your remains may \u003cem>not\u003c/em> remain … or that they may remain when they’re not \u003cem>supposed\u003c/em> to — and you’ll get a building on top of you to boot.\u003c/p>\n\u003cp>Ensuring that your final resting place is \u003cem>really\u003c/em> your final resting place was the very idea behind establishing Colma as a modern-day necropolis.\u003c/p>\n\u003cp>Yet even in Colma, the sanctity of the grave is not what it used to be. The needs and whims of the living have encroached over the years. For example, \u003ca href=\"http://smcgs.blogspot.com/2013/11/sunset-view-cemetery-sanfranciscos.html\" target=\"_blank\" rel=\"noopener noreferrer\">Sunset View Cemetery\u003c/a>, a burial ground for paupers, in 1951 became a golf course. (\u003ca href=\"http://sflib1.sfpl.org:82/search/a?searchtype=X&searcharg=%22sunset%22+view+cemetery&SORT=D\" target=\"_blank\" rel=\"noopener noreferrer\">Photos of the defunct cemetery\u003c/a> at the San Francisco Public Library.)\u003c/p>\n\u003cp>“The question I get so frequently is: ‘Is Colma safe?’ “says Svanevik. “I want to say Colma is safe, but I’ve noticed since 1970 the largest auto row south of San Francisco is in Colma. They have a Home Depot. At one point a portion of Greenlawn cemetery was cut away to make a movie theater.\u003c/p>\n\u003cp>“I can stand in Colma cemeteries today and hear a PA system say, ‘Your car is ready to be serviced.’ ”\u003c/p>\n\u003cp>And so it goes …\u003c/p>\n\u003cp>[ad floatright]\u003c/p>\n\u003cp>[baycuriousquestion]\u003c/p>\n\n","blocks":[],"excerpt":"Decades ago, hundreds of thousands of bodies were moved from San Francisco to Colma. ","status":"publish","parent":0,"modified":1700534668,"stats":{"hasAudio":false,"hasVideo":false,"hasChartOrMap":false,"iframeSrcs":[],"hasGoogleForm":false,"hasGallery":false,"hasHearkenModule":true,"hasPolis":false,"paragraphCount":76,"wordCount":2643},"headData":{"title":"Why Are There So Many Graves in Colma? And So Few in San Francisco? | KQED","description":"Decades ago, hundreds of thousands of bodies were moved from San Francisco to Colma. ","ogTitle":"","ogDescription":"","ogImgId":"","twTitle":"","twDescription":"","twImgId":"","schema":{"@context":"http://schema.org","@type":"NewsArticle","headline":"Why Are There So Many Graves in Colma? And So Few in San Francisco?","datePublished":"2021-10-07T10:00:07.000Z","dateModified":"2023-11-21T02:44:28.000Z","image":"https://cdn.kqed.org/wp-content/uploads/2020/02/KQED-OG-Image@1x.png","isAccessibleForFree":"Y","publisher":{"@type":"NewsMediaOrganization","@id":"https://www.kqed.org/#organization","name":"KQED","url":"https://www.kqed.org","logo":"https://cdn.kqed.org/wp-content/uploads/2020/02/KQED-OG-Image@1x.png"}}},"source":"Bay Curious","sourceUrl":"https://www.kqed.org/podcasts/baycurious","audioUrl":"https://www.kqed.org/.stream/anon/radio/bay-curious/2017/10/colma.mp3","path":"/news/10779164/why-are-so-many-dead-people-in-colma-and-so-few-in-san-francisco","audioDuration":483000,"audioTrackLength":null,"parsedContent":[{"type":"contentString","content":"\u003cdiv class=\"post-body\">\u003cp>\u003cp>\u003cem>This article was originally published Oct. 26, 2017. \u003c/em>\u003c/p>\n\u003cp>When you drive around the tiny town of Colma, just south of Daly City, you can’t help but notice a certain redundancy of scenery.\u003c/p>\n\u003cp>Tombstones. A florist …\u003c/p>\n\u003cp>More tombstones … another florist.\u003c/p>\n\u003cp>What Las Vegas is to gambling, Colma is to death.\u003c/p>\n\u003cp>\u003c/p>\u003c/div>","attributes":{"named":{},"numeric":[]}},{"type":"component","content":"","name":"ad","attributes":{"named":{"label":"fullwidth"},"numeric":["fullwidth"]}},{"type":"contentString","content":"\u003cdiv class=\"post-body\">\u003cp>\u003c/p>\n\u003cp>Nearly three-quarters of the 2.2-square-mile town is zoned for cemeteries — of which there are 17.\u003c/p>\n\u003cp>Colma is the last place you want to be when the zombie apocalypse goes down.\u003c/p>\n\u003cp>\u003c/p>\u003cp>\u003caside class=\"alignleft utils-parseShortcode-shortcodes-__bayCuriousPodcastShortcode__bayCurious\">\u003cimg src=https://cdn.kqed.org/wp-content/uploads/2023/02/bayCuriousLogo.png alt=\"Bay Curious Podcast\" />\n \u003ca href=\"/news/series/baycurious\">Bay Curious\u003c/a> is a podcast that answers your questions about the Bay Area.\n Subscribe on \u003ca href=\"https://itunes.apple.com/us/podcast/bay-curious/id1172473406\" target=\"_blank\" rel=\"noopener noreferrer\">Apple Podcasts\u003c/a>,\n \u003ca href=\"http://www.npr.org/podcasts/500557090/bay-curious\" target=\"_blank\" rel=\"noopener noreferrer\">NPR One\u003c/a> or your favorite podcast platform.\u003c/aside>\u003c/p>\u003cp>\u003c/p>\n\u003cp>The town’s population is 1,431, says Pat Hatfield of the local historical association.\u003c/p>\n\u003cp>“Of the living …,” I clarify.\u003c/p>\n\u003cp>She nods. “Above-ground residents, we call them. Maybe a million and a half underground, so we’re a little bit outgunned.”\u003c/p>\n\u003cfigure id=\"attachment_10795849\" class=\"wp-caption alignright\" style=\"max-width: 800px\">\u003ca href=\"http://ww2.kqed.org/news/wp-content/uploads/sites/10/2026/12/V0A9321.jpg\" rel=\"attachment wp-att-10795849\">\u003cimg decoding=\"async\" loading=\"lazy\" class=\"size-medium wp-image-10795849\" src=\"http://ww2.kqed.org/news/wp-content/uploads/sites/10/2026/12/V0A9321-800x533.jpg\" alt=\"In many parts of Colma, neat rows of gravestones are visible for as far as the eye can see.\" width=\"800\" height=\"533\" srcset=\"https://ww2.kqed.org/app/uploads/sites/10/2026/12/V0A9321-800x533.jpg 800w, https://ww2.kqed.org/app/uploads/sites/10/2026/12/V0A9321-400x267.jpg 400w, https://ww2.kqed.org/app/uploads/sites/10/2026/12/V0A9321-768x512.jpg 768w, https://ww2.kqed.org/app/uploads/sites/10/2026/12/V0A9321-1440x960.jpg 1440w, https://ww2.kqed.org/app/uploads/sites/10/2026/12/V0A9321-1920x1280.jpg 1920w, https://ww2.kqed.org/app/uploads/sites/10/2026/12/V0A9321-1180x787.jpg 1180w, https://ww2.kqed.org/app/uploads/sites/10/2026/12/V0A9321-960x640.jpg 960w\" sizes=\"(max-width: 800px) 100vw, 800px\">\u003c/a>\u003cfigcaption class=\"wp-caption-text\">In many parts of Colma, neat rows of gravestones are visible for as far as the eye can see. \u003ccite>(Olivia Allen-Price/KQED)\u003c/cite>\u003c/figcaption>\u003c/figure>\n\u003cp>The association’s headquarters sits quietly between two cemeteries. It doubles as a museum, with binders on display for each of the town’s final resting places. Flip through and your eye catches on bold-letter names like Joe DiMaggio and William Randolph Hearst. When death got the drop on Wyatt Earp, the legendary Old West lawman was buried in Hills of Eternity Memorial Park, a Jewish cemetery. (\u003ca href=\"http://www.neatorama.com/2011/11/16/why-wyatt-earp-is-buried-in-a-jewish-cemetery/\" target=\"_blank\" rel=\"noopener noreferrer\">Here’s why\u003c/a>.)\u003c/p>\n\u003cp>On the other hand, if you want to browse graves in San Francisco, your choices are limited.\u003c/p>\n\u003cp>There’s \u003ca href=\"http://www.cem.va.gov/cems/nchp/sanfrancisco.asp\" target=\"_blank\" rel=\"noopener noreferrer\">San Francisco National Cemetery\u003c/a> in the Presidio, but that’s technically on federal land.\u003c/p>\n\u003cp>The lone cemetery in the city proper is at \u003ca href=\"http://cemeterytravel.com/2011/04/27/cemetery-of-the-week-13-mission-dolores-cemetery/\" target=\"_blank\" rel=\"noopener noreferrer\">Mission Dolores\u003c/a>. But the cemetery is just one-sixth its original size, says Andrew Galvan, the Mission Dolores curator. Eleven thousand dead people were buried there from 1782 to 1898.\u003c/p>\n\u003cp>All right. That accounts for thousands of expired locals.\u003c/p>\n\u003cp>Where’s everybody else?\u003c/p>\n\u003ch3>San Francisco Graveyards of the Past\u003c/h3>\n\u003cp>San Francisco was once \u003ca href=\"http://www.sanfranciscocemeteries.com/\" target=\"_blank\" rel=\"noopener noreferrer\">full of cemeteries\u003c/a>.\u003c/p>\n\u003cp>“In the Gold Rush days they decided to build cemeteries in the western part of the city, where nobody would ever want to live,” says Michael Svanevik, a San Mateo County historian who’s the go-to guy on this topic.\u003c/p>\n\u003cp>Four huge cemeteries — Laurel Hill, Calvary, the Independent Order of Odd Fellows and the Masonic Cemetery — were established on land the University of San Francisco occupies today. These cemeteries took up between 60 and 70 square blocks. Golden Gate Cemetery, out by Lands End, took up a similar swath of space.\u003c/p>\n\u003cfigure id=\"attachment_10785902\" class=\"wp-caption aligncenter\" style=\"max-width: 720px\">\u003ca href=\"http://www.davidrumsey.com/luna/servlet/view/search?QuickSearchA=QuickSearchA&q=san+francisco+cemeteries&sort=pub_list_no_initialsort%2Cpub_list_no_initialsort%2Cpub_list_no_initialsort%2Cpub_date&search=Search\">\u003cimg decoding=\"async\" loading=\"lazy\" class=\"wp-image-10785902\" src=\"http://ww2.kqed.org/news/wp-content/uploads/sites/10/2015/12/Cemetery-map-highlighted_1873.jpg\" alt=\"Cemetery-map-highlighted_1873\" width=\"720\" height=\"513\" srcset=\"https://ww2.kqed.org/app/uploads/sites/10/2015/12/Cemetery-map-highlighted_1873.jpg 720w, https://ww2.kqed.org/app/uploads/sites/10/2015/12/Cemetery-map-highlighted_1873-400x285.jpg 400w\" sizes=\"(max-width: 720px) 100vw, 720px\">\u003c/a>\u003cfigcaption class=\"wp-caption-text\">An 1873 map shows the ‘Big Four’ cemeteries in San Francisco. (David Rumsey Map Collection) \u003ccite>(David Rumsey Historical Map Collection)\u003c/cite>\u003c/figcaption>\u003c/figure>\n\u003cp>As San Francisco’s population rapidly grew, homes were built on all sides of the cemetery complex. Streetcars had to navigate around these islands of the dead to transport residents to work and back.\u003c/p>\n\u003cp>“This now became very valuable land, and people turned against the cemeteries,” Svanevik says.\u003c/p>\n\u003cp>Just when you think the living have a hard time holding onto their place in San Francisco, imagine how the \u003cem>dead\u003c/em> fared.\u003c/p>\n\u003cfigure id=\"attachment_10787031\" class=\"wp-caption aligncenter\" style=\"max-width: 640px\">\u003ca href=\"http://ww2.kqed.org/news/wp-content/uploads/sites/10/2015/12/San-Francisco-Golden-Gate-Cemetery.png\" rel=\"attachment wp-att-10787031\">\u003cimg decoding=\"async\" loading=\"lazy\" class=\"wp-image-10787031 size-large\" src=\"http://ww2.kqed.org/news/wp-content/uploads/sites/10/2026/12/00944023-1440x879.jpg\" alt=\"Golden Gate, or City Cemetery, shown in an 1876 map by William P. Humphreys & Co.\" width=\"640\" height=\"391\" srcset=\"https://ww2.kqed.org/app/uploads/sites/10/2026/12/00944023-1440x879.jpg 1440w, https://ww2.kqed.org/app/uploads/sites/10/2026/12/00944023-400x244.jpg 400w, https://ww2.kqed.org/app/uploads/sites/10/2026/12/00944023-800x489.jpg 800w, https://ww2.kqed.org/app/uploads/sites/10/2026/12/00944023-1180x721.jpg 1180w, https://ww2.kqed.org/app/uploads/sites/10/2026/12/00944023-960x586.jpg 960w, https://ww2.kqed.org/app/uploads/sites/10/2026/12/00944023.jpg 1536w\" sizes=\"(max-width: 640px) 100vw, 640px\">\u003c/a>\u003cfigcaption class=\"wp-caption-text\">Golden Gate, or City Cemetery, shown in an 1876 map by William P. Humphreys & Co. (David Rumsey Map Collection) \u003ccite>(David Rumsey Historical Map Collection)\u003c/cite>\u003c/figcaption>\u003c/figure>\n\u003ch3>Public Opinion Turns\u003c/h3>\n\u003cp>By 1880, San Franciscans had grown disenchanted with its burgeoning population of dead folks.\u003c/p>\n\u003cp>Headlines like “Cemeteries must go!” began to show up in local newspapers, and residents became concerned over hysterical claims about health hazards.\u003c/p>\n\u003cp>“Scientists warned that throat maladies constantly assume a malignant type … when the patients are exposed to a wind that blows from a crowded cemetery,” wrote Svanevik and co-author Shirley Burgett in their book “\u003ca href=\"https://books.google.com/books?id=A_AXAQAAMAAJ&q=city+of+souls+colma&dq=city+of+souls+colma&hl=en&sa=X&ved=0ahUKEwjWhai10srJAhUBUmMKHS-cAc4Q6AEIHDAA\" target=\"_blank\" rel=\"noopener noreferrer\">City of Souls\u003c/a>.”\u003c/p>\n\u003cp>In 1901, San Francisco banned any new burials within city limits, part of what Svanevik and Burgett call a relentless assault on the city’s “belt of death.” For several decades, what to do with the cemeteries was a hot-button issue.\u003c/p>\n\u003cfigure id=\"attachment_10795858\" class=\"wp-caption alignright\" style=\"max-width: 800px\">\u003ca href=\"http://ww2.kqed.org/news/wp-content/uploads/sites/10/2026/12/lonehill.jpg\" rel=\"attachment wp-att-10795858\">\u003cimg decoding=\"async\" loading=\"lazy\" class=\"wp-image-10795858 size-medium\" src=\"http://ww2.kqed.org/news/wp-content/uploads/sites/10/2026/12/lonehill-800x606.jpg\" alt=\"With no endowments to pay for upkeep, cemeteries like Laurel Hill pictured here, fell into ruin. (Colma Historical Association)\" width=\"800\" height=\"606\" srcset=\"https://ww2.kqed.org/app/uploads/sites/10/2026/12/lonehill-800x606.jpg 800w, https://ww2.kqed.org/app/uploads/sites/10/2026/12/lonehill-400x303.jpg 400w, https://ww2.kqed.org/app/uploads/sites/10/2026/12/lonehill-768x582.jpg 768w, https://ww2.kqed.org/app/uploads/sites/10/2026/12/lonehill-1440x1091.jpg 1440w, https://ww2.kqed.org/app/uploads/sites/10/2026/12/lonehill-1920x1454.jpg 1920w, https://ww2.kqed.org/app/uploads/sites/10/2026/12/lonehill-1180x894.jpg 1180w, https://ww2.kqed.org/app/uploads/sites/10/2026/12/lonehill-960x727.jpg 960w\" sizes=\"(max-width: 800px) 100vw, 800px\">\u003c/a>\u003cfigcaption class=\"wp-caption-text\">With no endowments to pay for upkeep, cemeteries like Laurel Hill, pictured here, fell into ruin. (Colma Historical Association) \u003ccite>(CREDIT)\u003c/cite>\u003c/figcaption>\u003c/figure>\n\u003cp>Those who coveted valuable graveyard land could rely on at least one legitimate talking point: The cemeteries had become a real mess.\u003c/p>\n\u003cp>After San Francisco ended new burials, there was no money to care for existing cemetery grounds, and many graveyards fell into ruin. Statues and gravestones were toppled. The valuable bronze doors on private mausoleums were stolen. People would reportedly wander in and get drunk, or have late-night sex orgies.\u003c/p>\n\u003cp>“Entire skeletons were carried away to be used as Halloween decorations,” says Svanevik.\u003c/p>\n\u003cp>He’s even met people who report playing soccer with skulls.\u003c/p>\n\u003ch3>Colma: The Incorporation\u003c/h3>\n\u003cp>The first to move out of San Francisco were two Jewish cemeteries, Hills of Eternity and Home of Peace. In the 1880s, they abandoned the plots of land that now make up Dolores Park for the open farm area of Colma. A few years later, the San Francisco Archdiocese, running out of room in San Francisco, established Colma’s Holy Cross Cemetery.\u003c/p>\n\u003cp>As space for San Francisco burials grew tighter, more of San Francisco’s cemetery associations looked south, purchasing large plots of Colma’s farmland.\u003c/p>\n\u003cfigure id=\"attachment_10787086\" class=\"wp-caption aligncenter\" style=\"max-width: 640px\">\u003ca href=\"http://ww2.kqed.org/news/wp-content/uploads/sites/10/2015/12/San-Francisco-Jewish-Cemeteries.png\" rel=\"attachment wp-att-10787086\">\u003cimg decoding=\"async\" loading=\"lazy\" class=\"wp-image-10787086 size-large\" src=\"http://ww2.kqed.org/news/wp-content/uploads/sites/10/2026/12/Jewish-cemeteries-lg-1440x875.jpg\" alt=\"Until the 1880s, two Jewish cemeteries stood where Dolores Park is today. (Colma Historical Association)\" width=\"640\" height=\"389\" srcset=\"https://ww2.kqed.org/app/uploads/sites/10/2026/12/Jewish-cemeteries-lg-1440x875.jpg 1440w, https://ww2.kqed.org/app/uploads/sites/10/2026/12/Jewish-cemeteries-lg-400x243.jpg 400w, https://ww2.kqed.org/app/uploads/sites/10/2026/12/Jewish-cemeteries-lg-800x486.jpg 800w, https://ww2.kqed.org/app/uploads/sites/10/2026/12/Jewish-cemeteries-lg-1180x717.jpg 1180w, https://ww2.kqed.org/app/uploads/sites/10/2026/12/Jewish-cemeteries-lg-960x583.jpg 960w, https://ww2.kqed.org/app/uploads/sites/10/2026/12/Jewish-cemeteries-lg.jpg 1536w\" sizes=\"(max-width: 640px) 100vw, 640px\">\u003c/a>\u003cfigcaption class=\"wp-caption-text\">Until the 1880s, two Jewish cemeteries stood where Dolores Park is today. (Colma Historical Association) \u003ccite>(David Rumsey Historical Map Collection)\u003c/cite>\u003c/figcaption>\u003c/figure>\n\u003cp>In 1924, 14 cemetery associations incorporated the town of Lawndale (Colma’s original name). It is the only city incorporated for the sole purpose of preserving and protecting the dead, says the historical association’s Pat Hatfield.\u003c/p>\n\u003cp>The founders had good reason to be explicit about the new town’s purpose. After all, many of the remains that came to Colma had been moved several times. A body could have first been buried in the Gold Rush cemetery, only to be moved to Yerba Buena Cemetery, on to City Cemetery by the Legion of Honor, and finally to the cemetery complex where USF now stands.\u003c/p>\n\u003cp>“They didn’t want living people in Colma,” says Svanevik. “Every time somebody came forth and wanted to open a store, the town council voted it down, unless it was a floral shop or something associated with a cemetery.”\u003c/p>\n\u003ch3>San Francisco: And Then There Were Five\u003c/h3>\n\u003cp>By the 1920s, the only San Francisco cemeteries remaining were the so-called Big Four as well as the one at Mission Dolores. In the face of public hostility, the Odd Fellows and Masonic cemeteries agreed to move to Colma, but 17 families went to federal court to block the Masonic move. Those bodies were transferred only after sale of the land was approved in a 1930 Supreme Court ruling.\u003c/p>\n\u003cfigure id=\"attachment_10795864\" class=\"wp-caption aligncenter\" style=\"max-width: 800px\">\u003ca href=\"http://ww2.kqed.org/news/wp-content/uploads/sites/10/2026/12/calvary.jpg\" rel=\"attachment wp-att-10795864\">\u003cimg decoding=\"async\" loading=\"lazy\" class=\"wp-image-10795864 size-medium\" src=\"http://ww2.kqed.org/news/wp-content/uploads/sites/10/2026/12/calvary-800x508.jpg\" alt=\"Calvary cemetery from above in the 1930s. (Colma Historical Association)\" width=\"800\" height=\"508\" srcset=\"https://ww2.kqed.org/app/uploads/sites/10/2026/12/calvary-800x508.jpg 800w, https://ww2.kqed.org/app/uploads/sites/10/2026/12/calvary-400x254.jpg 400w, https://ww2.kqed.org/app/uploads/sites/10/2026/12/calvary-768x488.jpg 768w, https://ww2.kqed.org/app/uploads/sites/10/2026/12/calvary-1440x915.jpg 1440w, https://ww2.kqed.org/app/uploads/sites/10/2026/12/calvary-1920x1220.jpg 1920w, https://ww2.kqed.org/app/uploads/sites/10/2026/12/calvary-1180x750.jpg 1180w, https://ww2.kqed.org/app/uploads/sites/10/2026/12/calvary-960x610.jpg 960w\" sizes=\"(max-width: 800px) 100vw, 800px\">\u003c/a>\u003cfigcaption class=\"wp-caption-text\">Calvary Cemetery from above in the 1930s. (Colma Historical Association) \u003ccite>(San Francisco Public Library)\u003c/cite>\u003c/figcaption>\u003c/figure>\n\u003cp>The Catholic Church successfully made the case that the Mission Dolores cemetery should be allowed to stay for historical reasons. Andrew Galvan of Mission Dolores says just 60 bodies were moved to Colma between 1930 and 1932.\u003c/p>\n\u003cp>The Catholic Church also balked at uprooting Calvary Cemetery. The archdiocese didn’t like the idea of giving future plot owners in other cemeteries the idea that nothing is sacred or permanent — not even the place where you are laid to rest.\u003c/p>\n\u003cp>But eventually they relented, which left one cemetery — Laurel Hill. The rectangle of graves \u003ca href=\"http://www.sanfranciscocemeteries.com/laurelmap.html\" target=\"_blank\" rel=\"noopener noreferrer\">bounded by California, Geary, Parker and Presidio streets\u003c/a> was the lone holdout.\u003c/p>\n\u003caside class=\"alignleft\">\n\u003ch2>More on Colma\u003c/h2>\n\u003cp>\u003ca href=\"http://ww2.kqed.org/news/2015/12/16/is-colma-actually-shaped-like-an-angel\" target=\"_blank\" rel=\"noopener noreferrer\">\u003cimg decoding=\"async\" src=\"http://u.s.kqed.net/2015/12/16/colmaoutline.jpg\" alt=\"\">\u003c/a>\u003c/p>\n\u003ch3>Is Colma Shaped Like an Angel? Or Daemon?\u003c/h3>\n\u003cp>\u003ca href=\"http://ww2.kqed.org/news/2015/12/16/growing-up-in-colma\" target=\"_blank\" rel=\"noopener noreferrer\">\u003cimg decoding=\"async\" src=\"http://u.s.kqed.net/2015/12/16/smallcemetery.jpg\" alt=\"\">\u003c/a>\u003c/p>\n\u003ch3>What’s It Like to Grow Up in Colma?\u003c/h3>\n\u003cp> \u003c/p>\n\u003c/aside>\n\u003cp>Anti-cemetery activists made three unsuccessful attempts at ridding the city of Laurel Hill by putting the issue before voters.\u003c/p>\n\u003cp>In 1937 they \u003ca href=\"http://sfpl.org/pdf/main/gic/elections/November2_1937.pdf\" target=\"_blank\" rel=\"noopener noreferrer\">tried once more\u003c/a>. \u003cspan class=\"s1\">The official argument against the measure alluded to the many notable pioneers buried in the cemetery. “Gratitude and common decency should permit these dead to rest in honored peace,” it said.\u003c/span>\u003c/p>\n\u003cp class=\"p1\">\u003cspan class=\"s1\">On the pro-eviction side, proponents included photos of the decrepit graveyard marred by tumbled tombstones, above captions such as “Is this ‘respect for our dead’?” \u003c/span>\u003c/p>\n\u003cp class=\"p1\">This time, the measure to evict passed.\u003c/p>\n\u003ch3>Removing the Bodies\u003c/h3>\n\u003cp>Exhumation and transportation of the bodies was a very sophisticated operation.\u003c/p>\n\u003cp>If the casket was in good shape, they moved it with the body. If the casket had deteriorated, the bones were placed in boxes. Remains were required to be brought by hearse on the same day as exhumation, says Svanevik. The Catholic Church also required a priest to witness the exhumation of any bodies from Calvary Cemetery.\u003c/p>\n\u003cp>“Condition of remains disinterred varied from ‘dust’ to almost perfectly embalmed bodies, the latter resulting from filling of cast-iron caskets with groundwater acting as a preservative,” wrote William Proctor, in a 1950 \u003ca href=\"http://www.sfgenealogy.com/sf/history/hcmcpr.htm\" target=\"_blank\" rel=\"noopener noreferrer\">San Francisco Department of City Planning report\u003c/a>. “The smell of death was often present, even though the remains had been laid to rest from thirty to seventy years previously,” the head of the disinterment told Proctor.\u003c/p>\n\u003cfigure id=\"attachment_10795860\" class=\"wp-caption aligncenter\" style=\"max-width: 3723px\">\u003ca href=\"http://ww2.kqed.org/news/wp-content/uploads/sites/10/2026/12/oddfellows.jpg\" rel=\"attachment wp-att-10795860\">\u003cimg decoding=\"async\" loading=\"lazy\" class=\"wp-image-10795860 size-full\" src=\"http://ww2.kqed.org/news/wp-content/uploads/sites/10/2026/12/oddfellows.jpg\" alt=\"Workers remove bodies from the Odd Fellows cemetery. (Colma Historical Association)\" width=\"3723\" height=\"1578\" srcset=\"https://ww2.kqed.org/app/uploads/sites/10/2026/12/oddfellows.jpg 3723w, https://ww2.kqed.org/app/uploads/sites/10/2026/12/oddfellows-400x170.jpg 400w, https://ww2.kqed.org/app/uploads/sites/10/2026/12/oddfellows-800x339.jpg 800w, https://ww2.kqed.org/app/uploads/sites/10/2026/12/oddfellows-768x326.jpg 768w, https://ww2.kqed.org/app/uploads/sites/10/2026/12/oddfellows-1440x610.jpg 1440w, https://ww2.kqed.org/app/uploads/sites/10/2026/12/oddfellows-1920x814.jpg 1920w, https://ww2.kqed.org/app/uploads/sites/10/2026/12/oddfellows-1180x500.jpg 1180w, https://ww2.kqed.org/app/uploads/sites/10/2026/12/oddfellows-960x407.jpg 960w\" sizes=\"(max-width: 3723px) 100vw, 3723px\">\u003c/a>\u003cfigcaption class=\"wp-caption-text\">Workers remove bodies from the Odd Fellows Cemetery. (Colma Historical Association)\u003c/figcaption>\u003c/figure>\n\u003cp>About 130,000 bodies were disinterred from the “Big Four” cemeteries and moved to Colma. Most were reburied in mass graves, with a single monument to mark their presence.\u003c/p>\n\u003cp>For the 55,000 Catholic pioneers who were moved from San Francisco to Holy Cross in Colma, no marker identified them at their new resting place until 1993.\u003c/p>\n\u003ch3>Where the Tombstones Went\u003c/h3>\n\u003cp>When the San Francisco cemeteries were moved, the bodies were transported for free, but survivors had to pay if they wanted to keep the tombstones. Many survivors couldn’t be found, and the majority of tombstones did not make the trip to Colma. Instead, they were sold for a few pennies each to be used in public works, says Svanevik.\u003c/p>\n\u003cp>Some lined the gutters, which you can \u003ca href=\"http://www.thebolditalic.com/articles/4840-the-gutters-in-buena-vista-park-are-made-out-of-old-headstones\" target=\"_blank\" rel=\"noopener noreferrer\">still see\u003c/a>, in San Francisco’s Buena Vista Park. Others were spread around the city.\u003c/p>\n\u003cp>“Priceless crypts, tombs and private mausoleums were unceremoniously dumped in San Francisco Bay to create breakwaters at Aquatic Park and Saint Francis yacht club,” wrote Svanevik and Burgett in “City of Souls.”\u003c/p>\n\u003cp>And discarded tombstones were used to build a seawall along the Great Highway. They still resurface from time to time, as they did \u003ca href=\"http://www.sfgate.com/bayarea/article/Tombstones-from-long-ago-surfacing-on-S-F-beach-3618805.php\" target=\"_blank\" rel=\"noopener noreferrer\">in 2012 at Ocean Beach.\u003c/a>\u003c/p>\n\u003ch3>Some Left Behind\u003c/h3>\n\u003cp>“They missed a lot of the bodies,” says Alan Ziajka, the University of San Francisco’s official historian, speaking of the mass transfer to Colma. “No one knew that until 1950, when we put up our first major building after the Depression.”\u003c/p>\n\u003cp>That was \u003ca href=\"https://www.usfca.edu/virtual-tour/main-campus/gleeson-library\" target=\"_blank\" rel=\"noopener noreferrer\">Gleeson Library\u003c/a>, which like much of the university was built over what was once Masonic Cemetery. At least 200 bodies were found during excavations, when a backhoe churned up a whole mausoleum. Since then, every time a major excavation has occurred on campus, remains have been found.\u003c/p>\n\u003cp>A work crew breaking ground on the \u003ca href=\"https://www.usfca.edu/housing/residence-halls/hayes-healy\" target=\"_blank\" rel=\"noopener noreferrer\">Hayes-Healy residence hall\u003c/a> in 1966 “came upon so many bones and skulls that they refused to continue working until the human remains were moved from the site,” Ziajka wrote in his book, “Lighting the City, Changing the World, a History of the Sciences at the University of San Francisco.”\u003c/p>\n\u003cp>In 2011, when excavations began for the university’s \u003ca href=\"https://www.usfca.edu/virtual-tour/main-campus/lo-schiavo\" target=\"_blank\" rel=\"noopener noreferrer\">John Lo Schiavo, S.J. Center for Science and Innovation\u003c/a>, roughly 55 coffins, 29 skeletons and several skulls were unearthed.\u003c/p>\n\u003ch3>Legion of Honor: Where Bodies are Buried\u003c/h3>\n\u003cp>One of the most startling cemetery discoveries came in 1993, when the Legion of Honor was undergoing seismic renovation. As the dig began, about 750 bodies were discovered from the \u003ca href=\"http://www.sfgenealogy.com/sf/history/hcmcit.htm\" target=\"_blank\" rel=\"noopener noreferrer\">Golden Gate Cemetery\u003c/a>, also called City Cemetery, which was used from 1868 to 1909. About 18,000 people were buried there.\u003c/p>\n\u003cfigure class=\"wp-caption aligncenter\" style=\"max-width: 1718px\">\u003cimg decoding=\"async\" loading=\"lazy\" src=\"http://www.sfgenealogy.com/sf/history/hcmcitmap2.jpg\" alt=\"null\" width=\"1718\" height=\"1706\">\u003cfigcaption class=\"wp-caption-text\">A diagram of where human remains were found during a seismic renovation at the Legion of Honor in 1993. ( From ‘Health and Disease in 19th Century San Francisco,’ published in Historical Archaeology, 2005.)\u003c/figcaption>\u003c/figure>\n\u003cp>The \u003ca href=\"http://articles.latimes.com/1993-11-12/news/mn-56166_1_san-francisco-history\" target=\"_blank\" rel=\"noopener noreferrer\">L.A. Times reported\u003c/a> that remains included “a man who had a third arm buried with him, several medical-school cadavers and two coffins containing remnants of \u003ca href=\"http://www.history.com/this-day-in-history/levi-strauss-and-jacob-davis-receive-patent-for-blue-jeans\" target=\"_blank\" rel=\"noopener noreferrer\">denim with rivets stamped \u003c/a>\u003ci>\u003ca href=\"http://www.history.com/this-day-in-history/levi-strauss-and-jacob-davis-receive-patent-for-blue-jeans\" target=\"_blank\" rel=\"noopener noreferrer\">Levi\u003c/a>.”\u003c/i>\u003c/p>\n\u003cp>One person who got a close-up look at the Legion of Honor remains was photographer Richard Barnes. His \u003ca href=\"http://www.richardbarnes.net/still-rooms/\" target=\"_blank\" rel=\"noopener noreferrer\">exhibit on the discovery \u003c/a>has traveled around the country.\u003c/p>\n\u003cp>“I think the juxtaposition with the grand temple of art is pretty interesting,” Barnes says. “The idea of preservation of the past and what that represents. Whose past is honored and secured and whose is expendable?”\u003c/p>\n\u003cp>Barnes told \u003ca href=\"http://www.sfweekly.com/sanfrancisco/history-of-the-dead/Content?oid=2134634\" target=\"_blank\" rel=\"noopener noreferrer\">SF Weekly\u003c/a> in 1997 that the original Legion of Honor contractors, working in the early 1920s, “just plowed through burial sites, and plumbers laid pipes right through bodies and skeletons.”\u003c/p>\n\u003cp>“They threw headstones off the cliff into the ocean,” he says.\u003c/p>\n\u003cfigure id=\"attachment_10789711\" class=\"wp-caption aligncenter\" style=\"max-width: 750px\">\u003ca href=\"http://ww2.kqed.org/news/2015/12/16/why-are-so-many-dead-people-in-colma-and-so-few-in-san-francisco/stillrooms_008\" rel=\"attachment wp-att-10789711\">\u003cimg decoding=\"async\" loading=\"lazy\" class=\"wp-image-10789711 size-full\" src=\"http://ww2.kqed.org/news/wp-content/uploads/sites/10/2026/12/stillrooms_008.jpg\" alt='From the Richard Barnes exhibit \"Still Rooms & Excavations\" (Richard Barnes)' width=\"750\" height=\"571\" srcset=\"https://ww2.kqed.org/app/uploads/sites/10/2026/12/stillrooms_008.jpg 750w, https://ww2.kqed.org/app/uploads/sites/10/2026/12/stillrooms_008-400x305.jpg 400w\" sizes=\"(max-width: 750px) 100vw, 750px\">\u003c/a>\u003cfigcaption class=\"wp-caption-text\">From the Richard Barnes exhibit ‘Still Rooms & Excavations’ (Richard Barnes)\u003c/figcaption>\u003c/figure>\n\u003cfigure id=\"attachment_10789712\" class=\"wp-caption aligncenter\" style=\"max-width: 750px\">\u003ca href=\"http://ww2.kqed.org/news/2015/12/16/why-are-so-many-dead-people-in-colma-and-so-few-in-san-francisco/stillrooms_009\" rel=\"attachment wp-att-10789712\">\u003cimg decoding=\"async\" loading=\"lazy\" class=\"wp-image-10789712 size-full\" src=\"http://ww2.kqed.org/news/wp-content/uploads/sites/10/2026/12/stillrooms_009.jpg\" alt='Remains found during renovation at the Legion of Honor in San Francisco, 1993. From the Richard Barnes exhibit \"Still Rooms & Excavations.\" (Colma Historical Association)' width=\"750\" height=\"591\" srcset=\"https://ww2.kqed.org/app/uploads/sites/10/2026/12/stillrooms_009.jpg 750w, https://ww2.kqed.org/app/uploads/sites/10/2026/12/stillrooms_009-400x315.jpg 400w\" sizes=\"(max-width: 750px) 100vw, 750px\">\u003c/a>\u003cfigcaption class=\"wp-caption-text\">Remains found during renovation at the Legion of Honor in San Francisco, 1993. From the Richard Barnes exhibit ‘Still Rooms & Excavations.’ (Colma Historical Association)\u003c/figcaption>\u003c/figure>\n\u003cp>The Lincoln Park Golf Course was also built where Golden Gate Cemetery once stood.\u003c/p>\n\u003cp>From the \u003ca href=\"https://sites.google.com/site/lincolnparkgolfclub/History-of-Lincoln-Park\" target=\"_blank\" rel=\"noopener noreferrer\"> course’s website\u003c/a>:\u003c/p>\n\u003cblockquote>\u003cp>“What is presently the eighteenth fairway of the golf course was a burial ground, primarily for the city’s Italian community. The area that now constitutes the first and thirteenth fairway was the Chinese section of the cemetery and the high terrain at the fifteen fairway and thirteenth tee was a Serbian resting place.”\u003c/p>\u003c/blockquote>\n\u003ch3>Can It Happen Again?\u003c/h3>\n\u003cp>Some find the odyssey of San Francisco’s dead prior to the 20th century unnerving. Who knew that after you die, your body could be so peripatetic?\u003c/p>\n\u003cp>San Francisco is a testament to the reality that your remains may \u003cem>not\u003c/em> remain … or that they may remain when they’re not \u003cem>supposed\u003c/em> to — and you’ll get a building on top of you to boot.\u003c/p>\n\u003cp>Ensuring that your final resting place is \u003cem>really\u003c/em> your final resting place was the very idea behind establishing Colma as a modern-day necropolis.\u003c/p>\n\u003cp>Yet even in Colma, the sanctity of the grave is not what it used to be. The needs and whims of the living have encroached over the years. For example, \u003ca href=\"http://smcgs.blogspot.com/2013/11/sunset-view-cemetery-sanfranciscos.html\" target=\"_blank\" rel=\"noopener noreferrer\">Sunset View Cemetery\u003c/a>, a burial ground for paupers, in 1951 became a golf course. (\u003ca href=\"http://sflib1.sfpl.org:82/search/a?searchtype=X&searcharg=%22sunset%22+view+cemetery&SORT=D\" target=\"_blank\" rel=\"noopener noreferrer\">Photos of the defunct cemetery\u003c/a> at the San Francisco Public Library.)\u003c/p>\n\u003cp>“The question I get so frequently is: ‘Is Colma safe?’ “says Svanevik. “I want to say Colma is safe, but I’ve noticed since 1970 the largest auto row south of San Francisco is in Colma. They have a Home Depot. At one point a portion of Greenlawn cemetery was cut away to make a movie theater.\u003c/p>\n\u003cp>“I can stand in Colma cemeteries today and hear a PA system say, ‘Your car is ready to be serviced.’ ”\u003c/p>\n\u003cp>And so it goes …\u003c/p>\n\u003cp>\u003c/p>\u003c/div>","attributes":{"named":{},"numeric":[]}},{"type":"component","content":"","name":"ad","attributes":{"named":{"label":"floatright"},"numeric":["floatright"]}},{"type":"contentString","content":"\u003cdiv class=\"post-body\">\u003cp>\u003c/p>\n\u003cp>\u003c/p>\u003c/div>","attributes":{"named":{},"numeric":[]}},{"type":"component","content":"","name":"baycuriousquestion","attributes":{"named":{"label":""},"numeric":[]}},{"type":"contentString","content":"\u003cdiv class=\"post-body\">\u003cp>\u003c/p>\n\n\u003c/div>\u003c/p>","attributes":{"named":{},"numeric":[]}}],"link":"/news/10779164/why-are-so-many-dead-people-in-colma-and-so-few-in-san-francisco","authors":["80"],"programs":["news_6944","news_33523"],"series":["news_17986"],"categories":["news_8","news_33520"],"tags":["news_18426","news_3070"],"featImg":"news_10795862","label":"source_news_10779164"},"news_11844635":{"type":"posts","id":"news_11844635","meta":{"index":"posts_1591205157","site":"news","id":"11844635","score":null,"sort":[1604152839000]},"guestAuthors":[],"slug":"trump-focused-on-restricting-immigration-how-are-bay-area-immigrant-voters-responding","title":"Trump Focused on Restricting Immigration. How Are Bay Area Immigrant Voters Responding?","publishDate":1604152839,"format":"standard","headTitle":"The California Report | KQED News","labelTerm":{"term":72,"site":"news"},"content":"\u003cp>For Henok Welday, an Oakland resident, President Donald Trump’s immigration policies towards asylum seekers and refugees were top of mind when filling out his mail-in ballot at home.\u003c/p>\n\u003cp>The Eritrean immigrant won asylum in the U.S. and became a citizen about six years ago. Because of his experience, Welday said he is upset that the Trump administration has blocked \u003ca href=\"https://www.kqed.org/news/11801856/9-ways-trump-has-overhauled-immigration-to-the-us\">tens of thousands\u003c/a> of mostly Central American migrants from seeking humanitarian protections at the southern border.\u003c/p>\n\u003cp>“We are all human beings. I would like the chance that I’ve been given here to be given to other people too,” said Welday, who fled an Eritrean regime accused by the United Nations of crimes against humanity. “People may have no other choice than to leave their countries and seek a better life here.”\u003c/p>\n\u003cp>Trump has made restricting immigration, both legal and illegal, a central focus of his administration. As millions of Californians cast their ballots ahead of Nov. 3, many of the president’s strict immigration policies are on the minds of many — including the one out of every six registered voters in the state who are immigrants themselves.\u003c/p>\n\u003cp>Nationwide, eligible voters who are foreign born have grown to about 10% of the overall electorate, according to estimates by the Pew Research Center. And California has more naturalized U.S. citizens who are eligible to vote than any other state, about 5.5 million people.\u003c/p>\n\u003cfigure id=\"attachment_11844679\" class=\"wp-caption alignnone\" style=\"max-width: 800px\">\u003cimg class=\"size-medium wp-image-11844679\" src=\"https://ww2.kqed.org/app/uploads/sites/10/2020/10/RS45481_029_KQED_Oakland_RegistrarofVoters_10272020-qut-800x533.jpg\" alt=\"A voter approaches an Alameda County Registrar of Voters ballot drop box in Oakland on Oct. 27, 2020.\" width=\"800\" height=\"533\" srcset=\"https://ww2.kqed.org/app/uploads/sites/10/2020/10/RS45481_029_KQED_Oakland_RegistrarofVoters_10272020-qut-800x533.jpg 800w, https://ww2.kqed.org/app/uploads/sites/10/2020/10/RS45481_029_KQED_Oakland_RegistrarofVoters_10272020-qut-1020x680.jpg 1020w, https://ww2.kqed.org/app/uploads/sites/10/2020/10/RS45481_029_KQED_Oakland_RegistrarofVoters_10272020-qut-160x107.jpg 160w, https://ww2.kqed.org/app/uploads/sites/10/2020/10/RS45481_029_KQED_Oakland_RegistrarofVoters_10272020-qut-1536x1024.jpg 1536w, https://ww2.kqed.org/app/uploads/sites/10/2020/10/RS45481_029_KQED_Oakland_RegistrarofVoters_10272020-qut.jpg 1920w\" sizes=\"(max-width: 800px) 100vw, 800px\">\u003cfigcaption class=\"wp-caption-text\">A voter approaches an Alameda County Registrar of Voters ballot drop box in Oakland on Oct. 27, 2020. \u003ccite>(Beth LaBerge/KQED)\u003c/cite>\u003c/figcaption>\u003c/figure>\n\u003cp>Welday voted for the first time this presidential election and said he regretted not casting his ballot in 2016, even though he had the right to do so.\u003c/p>\n\u003cp>On Tuesday morning, he brought his six-year old son Nathan with him to drop off his ballot at an official drop box outside the Alameda County Superior Courthouse in Oakland.\u003c/p>\n\u003cp>“I wanted him to see what's the right thing to do,” said Welday. “Whatever his choices may be. But it's always to let your voice be heard.”\u003c/p>\n\u003cp>Glancing at his son, he said he doesn’t want a president that ordered border authorities to separate nearly \u003ca href=\"https://www.kqed.org/news/11782685/new-tally-totals-over-5500-kids-taken-from-parents-at-the-border\">5,500\u003c/a> migrant children from their parents, including hundreds who have not yet been reunited.\u003c/p>\n\u003cp>“It's saddening,” said Welday, shaking his head. “I mean, as a parent, you wouldn't want to be away from your child for one day. Forget about being in two countries.”\u003c/p>\n\u003cfigure id=\"attachment_11844646\" class=\"wp-caption aligncenter\" style=\"max-width: 1920px\">\u003cimg class=\"size-full wp-image-11844646\" src=\"https://ww2.kqed.org/app/uploads/sites/10/2020/10/RS45488_036_KQED_Oakland_RegistrarofVoters_10272020-qut.jpg\" alt=\"\" width=\"1920\" height=\"1280\" srcset=\"https://ww2.kqed.org/app/uploads/sites/10/2020/10/RS45488_036_KQED_Oakland_RegistrarofVoters_10272020-qut.jpg 1920w, https://ww2.kqed.org/app/uploads/sites/10/2020/10/RS45488_036_KQED_Oakland_RegistrarofVoters_10272020-qut-800x533.jpg 800w, https://ww2.kqed.org/app/uploads/sites/10/2020/10/RS45488_036_KQED_Oakland_RegistrarofVoters_10272020-qut-1020x680.jpg 1020w, https://ww2.kqed.org/app/uploads/sites/10/2020/10/RS45488_036_KQED_Oakland_RegistrarofVoters_10272020-qut-160x107.jpg 160w, https://ww2.kqed.org/app/uploads/sites/10/2020/10/RS45488_036_KQED_Oakland_RegistrarofVoters_10272020-qut-1536x1024.jpg 1536w\" sizes=\"(max-width: 1920px) 100vw, 1920px\">\u003cfigcaption class=\"wp-caption-text\">Naomi Means walks in Oakland's Chinatown on Oct. 27, 2020. Means, an immigrant from Japan, became a U.S. citizen nearly two decades ago. \u003ccite>(Beth LaBerge/KQED)\u003c/cite>\u003c/figcaption>\u003c/figure>\n\u003cp>Walking the streets of Oakland’s Chinatown, Naomi Means also said the president’s treatment of immigrants was a key factor in her vote for Democratic presidential candidate Joe Biden.\u003c/p>\n\u003cp>Means, a special education teacher, disagreed with Trump’s \u003ca href=\"https://publicpool.kinja.com/subject-presidential-determination-on-refugee-admissio-1845502954\">order\u003c/a> to admit only up to 15,000 refugees next year, an all-time low. Previous Republican and Democratic administrations typically set the refugee cap at more than \u003ca href=\"https://www.washingtonpost.com/immigration/trump-cuts-refugee-cap/2020/10/01/a5113b62-03ed-11eb-8879-7663b816bfa5_story.html\">70,000\u003c/a> people per year.\u003c/p>\n\u003cp>[aside tag=\"election-2020\" label=\"Election 2020 Coverage\"]\u003c/p>\n\u003cp>“I really feel for them,” said Means, 61, originally from Japan. “I don’t agree with excluding other people. This is a country of immigrants anyway, and except for Native Americans, everybody else came from other parts of this earth.”\u003c/p>\n\u003cp>But for other naturalized citizens outside of deep-blue Oakland, immigration was not a top issue defining their votes.\u003c/p>\n\u003cp>Mohamed Elsherbini, an immigrant from Egypt, has owned a tour company in the Bay Area for more than three decades. He said his main concerns this election are national security and the economy.\u003c/p>\n\u003cp>“I understand that California is mainly a blue state, but I believe that Trump has a better chance to lead our country to economic growth and safety and stand up to any dangers, whether from terrorist groups, or stand up for better economic deals with China,” said Elsherbini, 58.\u003c/p>\n\u003cfigure id=\"attachment_11844779\" class=\"wp-caption alignnone\" style=\"max-width: 800px\">\u003cimg class=\"size-medium wp-image-11844779\" src=\"https://ww2.kqed.org/app/uploads/sites/10/2020/10/Elhersbini_v2-1-800x537.jpg\" alt=\"Mohamed Elsherbini, an immigrant from Egypt, poses next to an American flag. Elsherbini is running for a seat on Danville's town council.\" width=\"800\" height=\"537\" srcset=\"https://ww2.kqed.org/app/uploads/sites/10/2020/10/Elhersbini_v2-1-800x537.jpg 800w, https://ww2.kqed.org/app/uploads/sites/10/2020/10/Elhersbini_v2-1-1020x685.jpg 1020w, https://ww2.kqed.org/app/uploads/sites/10/2020/10/Elhersbini_v2-1-160x107.jpg 160w, https://ww2.kqed.org/app/uploads/sites/10/2020/10/Elhersbini_v2-1-1536x1031.jpg 1536w, https://ww2.kqed.org/app/uploads/sites/10/2020/10/Elhersbini_v2-1.jpg 1600w\" sizes=\"(max-width: 800px) 100vw, 800px\">\u003cfigcaption class=\"wp-caption-text\">Mohamed Elsherbini, an immigrant from Egypt, poses next to an American flag. Elsherbini is running for a seat on Danville's town council. \u003ccite>(Courtesy of Mohamed Elsherbini)\u003c/cite>\u003c/figcaption>\u003c/figure>\n\u003cp>After living more than 20 years in Danville, Elsherbini is now a candidate himself, running for town council to support small businesses and help create jobs, he said.\u003c/p>\n\u003cp>“I know the city very well, and I know what we need to keep Danville safe, balance the budget and support local businesses,” said Elsherbini, who identifies as a conservative and GOP supporter.\u003c/p>\n\u003cp>Republicans represent nearly 20% of the nearly 3.8 million California voters identified as foreign born, according to Political Data, Inc. Meanwhile, Democrats are about half of immigrant voters in the state, and a third have no party preference.\u003c/p>\n\u003cp>[ad fullwidth]\u003c/p>\n\u003cp>Elsherbini’s friend Muhammed Jawaid, also a Danville resident, said he voted for Trump in 2016. But this year, he cast his vote for Biden.\u003c/p>\n\u003cp>Jawaid, a retired network analyst for tech companies, said he wants the next commander-in-chief to act urgently to solve climate change.\u003c/p>\n\u003cp>“Trump doesn't believe in science,” said Jawaid, 66. “I mean, it's mind boggling in this day and age. We have the data under our fingertips, and it is showing that it is us humans that are warming the planet.”\u003c/p>\n\u003cfigure id=\"attachment_11844780\" class=\"wp-caption alignnone\" style=\"max-width: 800px\">\u003cimg class=\"size-medium wp-image-11844780\" src=\"https://ww2.kqed.org/app/uploads/sites/10/2020/10/Jawaid_v2-1-800x450.jpg\" alt=\"Muhammed Jawaid, an immigrant from Pakistan, poses in front of his Danville home by a yard sign supporting his friend Mohamed Elsherbini's campaign for Danville town council.\" width=\"800\" height=\"450\" srcset=\"https://ww2.kqed.org/app/uploads/sites/10/2020/10/Jawaid_v2-1-800x450.jpg 800w, https://ww2.kqed.org/app/uploads/sites/10/2020/10/Jawaid_v2-1-1020x574.jpg 1020w, https://ww2.kqed.org/app/uploads/sites/10/2020/10/Jawaid_v2-1-160x90.jpg 160w, https://ww2.kqed.org/app/uploads/sites/10/2020/10/Jawaid_v2-1-1536x864.jpg 1536w, https://ww2.kqed.org/app/uploads/sites/10/2020/10/Jawaid_v2-1-2048x1152.jpg 2048w, https://ww2.kqed.org/app/uploads/sites/10/2020/10/Jawaid_v2-1-1920x1080.jpg 1920w\" sizes=\"(max-width: 800px) 100vw, 800px\">\u003cfigcaption class=\"wp-caption-text\">Muhammed Jawaid, an immigrant from Pakistan, poses in front of his Danville home by a yard sign supporting his friend Mohamed Elsherbini's campaign for Danville town council. \u003ccite>(Courtesy of Muhammed Jawaid)\u003c/cite>\u003c/figcaption>\u003c/figure>\n\u003cp>As a Muslim from Pakistan, Jawaid worries the president’s \u003ca href=\"https://www.kqed.org/news/11802728/california-immigrants-grapple-with-trumps-expanded-travel-ban\">travel ban\u003c/a> and rhetoric against non-white immigrants will lead to discrimination, including against his own family. He said he hopes the next U.S. leader will treat all citizens equally, no matter their race or what country they came from.\u003c/p>\n\u003cp>“If they're Americans, they are Americans, period. They have taken an oath,” said Jawaid, 66. “But if you start alienating them and you say you're not equal to a white race, then that can be detrimental in the long run to the country.”\u003c/p>\n\u003cp>\u003c/p>\n","blocks":[],"excerpt":"Naturalized citizens from Eritrea, Japan, Egypt and Pakistan weigh in on how Trump's immigration policies are influencing their vote this fall","status":"publish","parent":0,"modified":1604421873,"stats":{"hasAudio":false,"hasVideo":false,"hasChartOrMap":false,"iframeSrcs":[],"hasGoogleForm":false,"hasGallery":false,"hasHearkenModule":false,"hasPolis":false,"paragraphCount":27,"wordCount":1046},"headData":{"title":"Trump Focused on Restricting Immigration. How Are Bay Area Immigrant Voters Responding? | KQED","description":"Naturalized citizens from Eritrea, Japan, Egypt and Pakistan weigh in on how Trump's immigration policies are influencing their vote this fall","ogTitle":"","ogDescription":"","ogImgId":"","twTitle":"","twDescription":"","twImgId":"","schema":{"@context":"http://schema.org","@type":"NewsArticle","headline":"Trump Focused on Restricting Immigration. How Are Bay Area Immigrant Voters Responding?","datePublished":"2020-10-31T14:00:39.000Z","dateModified":"2020-11-03T16:44:33.000Z","image":"https://cdn.kqed.org/wp-content/uploads/2020/02/KQED-OG-Image@1x.png","isAccessibleForFree":"Y","publisher":{"@type":"NewsMediaOrganization","@id":"https://www.kqed.org/#organization","name":"KQED","url":"https://www.kqed.org","logo":"https://cdn.kqed.org/wp-content/uploads/2020/02/KQED-OG-Image@1x.png"}}},"disqusIdentifier":"11844635 https://ww2.kqed.org/news/?p=11844635","disqusUrl":"https://ww2.kqed.org/news/2020/10/31/trump-focused-on-restricting-immigration-how-are-bay-area-immigrant-voters-responding/","disqusTitle":"Trump Focused on Restricting Immigration. How Are Bay Area Immigrant Voters Responding?","audioUrl":"https://traffic.omny.fm/d/clips/0af137ef-751e-4b19-a055-aaef00d2d578/ffca7e9f-6831-41c5-bcaf-aaef00f5a073/18615a05-15da-471a-bcd8-ac64012066cb/audio.mp3","path":"/news/11844635/trump-focused-on-restricting-immigration-how-are-bay-area-immigrant-voters-responding","audioTrackLength":null,"parsedContent":[{"type":"contentString","content":"\u003cdiv class=\"post-body\">\u003cp>\u003cp>For Henok Welday, an Oakland resident, President Donald Trump’s immigration policies towards asylum seekers and refugees were top of mind when filling out his mail-in ballot at home.\u003c/p>\n\u003cp>The Eritrean immigrant won asylum in the U.S. and became a citizen about six years ago. Because of his experience, Welday said he is upset that the Trump administration has blocked \u003ca href=\"https://www.kqed.org/news/11801856/9-ways-trump-has-overhauled-immigration-to-the-us\">tens of thousands\u003c/a> of mostly Central American migrants from seeking humanitarian protections at the southern border.\u003c/p>\n\u003cp>“We are all human beings. I would like the chance that I’ve been given here to be given to other people too,” said Welday, who fled an Eritrean regime accused by the United Nations of crimes against humanity. “People may have no other choice than to leave their countries and seek a better life here.”\u003c/p>\n\u003cp>Trump has made restricting immigration, both legal and illegal, a central focus of his administration. As millions of Californians cast their ballots ahead of Nov. 3, many of the president’s strict immigration policies are on the minds of many — including the one out of every six registered voters in the state who are immigrants themselves.\u003c/p>\n\u003cp>Nationwide, eligible voters who are foreign born have grown to about 10% of the overall electorate, according to estimates by the Pew Research Center. And California has more naturalized U.S. citizens who are eligible to vote than any other state, about 5.5 million people.\u003c/p>\n\u003cfigure id=\"attachment_11844679\" class=\"wp-caption alignnone\" style=\"max-width: 800px\">\u003cimg class=\"size-medium wp-image-11844679\" src=\"https://ww2.kqed.org/app/uploads/sites/10/2020/10/RS45481_029_KQED_Oakland_RegistrarofVoters_10272020-qut-800x533.jpg\" alt=\"A voter approaches an Alameda County Registrar of Voters ballot drop box in Oakland on Oct. 27, 2020.\" width=\"800\" height=\"533\" srcset=\"https://ww2.kqed.org/app/uploads/sites/10/2020/10/RS45481_029_KQED_Oakland_RegistrarofVoters_10272020-qut-800x533.jpg 800w, https://ww2.kqed.org/app/uploads/sites/10/2020/10/RS45481_029_KQED_Oakland_RegistrarofVoters_10272020-qut-1020x680.jpg 1020w, https://ww2.kqed.org/app/uploads/sites/10/2020/10/RS45481_029_KQED_Oakland_RegistrarofVoters_10272020-qut-160x107.jpg 160w, https://ww2.kqed.org/app/uploads/sites/10/2020/10/RS45481_029_KQED_Oakland_RegistrarofVoters_10272020-qut-1536x1024.jpg 1536w, https://ww2.kqed.org/app/uploads/sites/10/2020/10/RS45481_029_KQED_Oakland_RegistrarofVoters_10272020-qut.jpg 1920w\" sizes=\"(max-width: 800px) 100vw, 800px\">\u003cfigcaption class=\"wp-caption-text\">A voter approaches an Alameda County Registrar of Voters ballot drop box in Oakland on Oct. 27, 2020. \u003ccite>(Beth LaBerge/KQED)\u003c/cite>\u003c/figcaption>\u003c/figure>\n\u003cp>Welday voted for the first time this presidential election and said he regretted not casting his ballot in 2016, even though he had the right to do so.\u003c/p>\n\u003cp>On Tuesday morning, he brought his six-year old son Nathan with him to drop off his ballot at an official drop box outside the Alameda County Superior Courthouse in Oakland.\u003c/p>\n\u003cp>“I wanted him to see what's the right thing to do,” said Welday. “Whatever his choices may be. But it's always to let your voice be heard.”\u003c/p>\n\u003cp>Glancing at his son, he said he doesn’t want a president that ordered border authorities to separate nearly \u003ca href=\"https://www.kqed.org/news/11782685/new-tally-totals-over-5500-kids-taken-from-parents-at-the-border\">5,500\u003c/a> migrant children from their parents, including hundreds who have not yet been reunited.\u003c/p>\n\u003cp>“It's saddening,” said Welday, shaking his head. “I mean, as a parent, you wouldn't want to be away from your child for one day. Forget about being in two countries.”\u003c/p>\n\u003cfigure id=\"attachment_11844646\" class=\"wp-caption aligncenter\" style=\"max-width: 1920px\">\u003cimg class=\"size-full wp-image-11844646\" src=\"https://ww2.kqed.org/app/uploads/sites/10/2020/10/RS45488_036_KQED_Oakland_RegistrarofVoters_10272020-qut.jpg\" alt=\"\" width=\"1920\" height=\"1280\" srcset=\"https://ww2.kqed.org/app/uploads/sites/10/2020/10/RS45488_036_KQED_Oakland_RegistrarofVoters_10272020-qut.jpg 1920w, https://ww2.kqed.org/app/uploads/sites/10/2020/10/RS45488_036_KQED_Oakland_RegistrarofVoters_10272020-qut-800x533.jpg 800w, https://ww2.kqed.org/app/uploads/sites/10/2020/10/RS45488_036_KQED_Oakland_RegistrarofVoters_10272020-qut-1020x680.jpg 1020w, https://ww2.kqed.org/app/uploads/sites/10/2020/10/RS45488_036_KQED_Oakland_RegistrarofVoters_10272020-qut-160x107.jpg 160w, https://ww2.kqed.org/app/uploads/sites/10/2020/10/RS45488_036_KQED_Oakland_RegistrarofVoters_10272020-qut-1536x1024.jpg 1536w\" sizes=\"(max-width: 1920px) 100vw, 1920px\">\u003cfigcaption class=\"wp-caption-text\">Naomi Means walks in Oakland's Chinatown on Oct. 27, 2020. Means, an immigrant from Japan, became a U.S. citizen nearly two decades ago. \u003ccite>(Beth LaBerge/KQED)\u003c/cite>\u003c/figcaption>\u003c/figure>\n\u003cp>Walking the streets of Oakland’s Chinatown, Naomi Means also said the president’s treatment of immigrants was a key factor in her vote for Democratic presidential candidate Joe Biden.\u003c/p>\n\u003cp>Means, a special education teacher, disagreed with Trump’s \u003ca href=\"https://publicpool.kinja.com/subject-presidential-determination-on-refugee-admissio-1845502954\">order\u003c/a> to admit only up to 15,000 refugees next year, an all-time low. Previous Republican and Democratic administrations typically set the refugee cap at more than \u003ca href=\"https://www.washingtonpost.com/immigration/trump-cuts-refugee-cap/2020/10/01/a5113b62-03ed-11eb-8879-7663b816bfa5_story.html\">70,000\u003c/a> people per year.\u003c/p>\n\u003cp>\u003c/p>\u003c/div>","attributes":{"named":{},"numeric":[]}},{"type":"component","content":"","name":"aside","attributes":{"named":{"tag":"election-2020","label":"Election 2020 Coverage "},"numeric":[]}},{"type":"contentString","content":"\u003cdiv class=\"post-body\">\u003cp>\u003c/p>\n\u003cp>“I really feel for them,” said Means, 61, originally from Japan. “I don’t agree with excluding other people. This is a country of immigrants anyway, and except for Native Americans, everybody else came from other parts of this earth.”\u003c/p>\n\u003cp>But for other naturalized citizens outside of deep-blue Oakland, immigration was not a top issue defining their votes.\u003c/p>\n\u003cp>Mohamed Elsherbini, an immigrant from Egypt, has owned a tour company in the Bay Area for more than three decades. He said his main concerns this election are national security and the economy.\u003c/p>\n\u003cp>“I understand that California is mainly a blue state, but I believe that Trump has a better chance to lead our country to economic growth and safety and stand up to any dangers, whether from terrorist groups, or stand up for better economic deals with China,” said Elsherbini, 58.\u003c/p>\n\u003cfigure id=\"attachment_11844779\" class=\"wp-caption alignnone\" style=\"max-width: 800px\">\u003cimg class=\"size-medium wp-image-11844779\" src=\"https://ww2.kqed.org/app/uploads/sites/10/2020/10/Elhersbini_v2-1-800x537.jpg\" alt=\"Mohamed Elsherbini, an immigrant from Egypt, poses next to an American flag. Elsherbini is running for a seat on Danville's town council.\" width=\"800\" height=\"537\" srcset=\"https://ww2.kqed.org/app/uploads/sites/10/2020/10/Elhersbini_v2-1-800x537.jpg 800w, https://ww2.kqed.org/app/uploads/sites/10/2020/10/Elhersbini_v2-1-1020x685.jpg 1020w, https://ww2.kqed.org/app/uploads/sites/10/2020/10/Elhersbini_v2-1-160x107.jpg 160w, https://ww2.kqed.org/app/uploads/sites/10/2020/10/Elhersbini_v2-1-1536x1031.jpg 1536w, https://ww2.kqed.org/app/uploads/sites/10/2020/10/Elhersbini_v2-1.jpg 1600w\" sizes=\"(max-width: 800px) 100vw, 800px\">\u003cfigcaption class=\"wp-caption-text\">Mohamed Elsherbini, an immigrant from Egypt, poses next to an American flag. Elsherbini is running for a seat on Danville's town council. \u003ccite>(Courtesy of Mohamed Elsherbini)\u003c/cite>\u003c/figcaption>\u003c/figure>\n\u003cp>After living more than 20 years in Danville, Elsherbini is now a candidate himself, running for town council to support small businesses and help create jobs, he said.\u003c/p>\n\u003cp>“I know the city very well, and I know what we need to keep Danville safe, balance the budget and support local businesses,” said Elsherbini, who identifies as a conservative and GOP supporter.\u003c/p>\n\u003cp>Republicans represent nearly 20% of the nearly 3.8 million California voters identified as foreign born, according to Political Data, Inc. Meanwhile, Democrats are about half of immigrant voters in the state, and a third have no party preference.\u003c/p>\n\u003cp>\u003c/p>\u003c/div>","attributes":{"named":{},"numeric":[]}},{"type":"component","content":"","name":"ad","attributes":{"named":{"label":"fullwidth"},"numeric":["fullwidth"]}},{"type":"contentString","content":"\u003cdiv class=\"post-body\">\u003cp>\u003c/p>\n\u003cp>Elsherbini’s friend Muhammed Jawaid, also a Danville resident, said he voted for Trump in 2016. But this year, he cast his vote for Biden.\u003c/p>\n\u003cp>Jawaid, a retired network analyst for tech companies, said he wants the next commander-in-chief to act urgently to solve climate change.\u003c/p>\n\u003cp>“Trump doesn't believe in science,” said Jawaid, 66. “I mean, it's mind boggling in this day and age. We have the data under our fingertips, and it is showing that it is us humans that are warming the planet.”\u003c/p>\n\u003cfigure id=\"attachment_11844780\" class=\"wp-caption alignnone\" style=\"max-width: 800px\">\u003cimg class=\"size-medium wp-image-11844780\" src=\"https://ww2.kqed.org/app/uploads/sites/10/2020/10/Jawaid_v2-1-800x450.jpg\" alt=\"Muhammed Jawaid, an immigrant from Pakistan, poses in front of his Danville home by a yard sign supporting his friend Mohamed Elsherbini's campaign for Danville town council.\" width=\"800\" height=\"450\" srcset=\"https://ww2.kqed.org/app/uploads/sites/10/2020/10/Jawaid_v2-1-800x450.jpg 800w, https://ww2.kqed.org/app/uploads/sites/10/2020/10/Jawaid_v2-1-1020x574.jpg 1020w, https://ww2.kqed.org/app/uploads/sites/10/2020/10/Jawaid_v2-1-160x90.jpg 160w, https://ww2.kqed.org/app/uploads/sites/10/2020/10/Jawaid_v2-1-1536x864.jpg 1536w, https://ww2.kqed.org/app/uploads/sites/10/2020/10/Jawaid_v2-1-2048x1152.jpg 2048w, https://ww2.kqed.org/app/uploads/sites/10/2020/10/Jawaid_v2-1-1920x1080.jpg 1920w\" sizes=\"(max-width: 800px) 100vw, 800px\">\u003cfigcaption class=\"wp-caption-text\">Muhammed Jawaid, an immigrant from Pakistan, poses in front of his Danville home by a yard sign supporting his friend Mohamed Elsherbini's campaign for Danville town council. \u003ccite>(Courtesy of Muhammed Jawaid)\u003c/cite>\u003c/figcaption>\u003c/figure>\n\u003cp>As a Muslim from Pakistan, Jawaid worries the president’s \u003ca href=\"https://www.kqed.org/news/11802728/california-immigrants-grapple-with-trumps-expanded-travel-ban\">travel ban\u003c/a> and rhetoric against non-white immigrants will lead to discrimination, including against his own family. He said he hopes the next U.S. leader will treat all citizens equally, no matter their race or what country they came from.\u003c/p>\n\u003cp>“If they're Americans, they are Americans, period. They have taken an oath,” said Jawaid, 66. “But if you start alienating them and you say you're not equal to a white race, then that can be detrimental in the long run to the country.”\u003c/p>\n\u003cp>\u003c/p>\n\u003c/div>\u003c/p>","attributes":{"named":{},"numeric":[]}}],"link":"/news/11844635/trump-focused-on-restricting-immigration-how-are-bay-area-immigrant-voters-responding","authors":["8659"],"programs":["news_6944","news_72"],"categories":["news_1169","news_8"],"tags":["news_27540","news_27370","news_20611","news_20202","news_2027"],"featImg":"news_11844647","label":"news_72"},"news_11841961":{"type":"posts","id":"news_11841961","meta":{"index":"posts_1591205157","site":"news","id":"11841961","score":null,"sort":[1602714389000]},"guestAuthors":[],"slug":"what-role-would-california-play-if-the-election-outcome-gets-complicated","title":"What Role Would California Play if the Election Outcome Gets Complicated?","publishDate":1602714389,"format":"standard","headTitle":"Election 2016 | The California Report | KQED News","labelTerm":{"term":72,"site":"news"},"content":"\u003cp>The presidential election is just weeks away, and it's been a wild ride as COVID-19 has upended the traditional forms of campaigning.\u003c/p>\n\u003cp>Democratic nominee and former Vice President Joe Biden has opted for socially distanced and virtual events. He's generally seen wearing a mask unless he's speaking. By contrast, President Donald Trump moved forward with the large campaign rallies he prefers, often without wearing a mask. Earlier this month, \u003ca href=\"https://www.npr.org/sections/latest-updates-trump-covid-19-results/2020/10/03/919898777/timeline-what-we-know-of-president-trumps-covid-19-diagnosis\">Trump contracted COVID-19\u003c/a>, which resulted in a brief hospital stay.\u003c/p>\n\u003cp>While Trump maintains he's recovered, and Biden has not had the virus, the president's illness has raised questions about the health of both nominees, who are each well into their 70's: What happens if the person who wins the election on November 3 passes away before they're sworn into office? [aside tag=\"election-2020\" label=\"more election coverage\"]\u003c/p>\n\u003cp>According to Jessica Levinson, Loyola Law School professor and host of the podcast \"Casting Judgement\", the election laws are a bit murky, but the answer largely depends on when the incident occurs.\u003c/p>\n\u003cp>The members of the Electoral College meet to cast their votes for president on December 14, 2020. Generally the party that won the popular vote in a state gets to pick that state's electors. But, if the winning candidate dies before the members meet, Levinson said the candidate's political party would choose a new nominee.\u003c/p>\n\u003cp>\"Either the Democratic National Committee or the Republican National Committee have procedures in place and they would pick a new nominee. And then, the idea is that the members of the Electoral College — because they are party loyalists — would vote for that (nominee),\" Levinson said.\u003c/p>\n\u003cp>But even once the Electoral College votes are cast, there's still potential for uncertainty. That's because Congress won't formally certify the election results until January 6, 2021.\u003c/p>\n\u003cp>\"It’s a mess in that period,\" said Richard Hasen in an email. He's a professor of law and political science at the University of California, Irvine, and has written about \u003ca href=\"https://www.cnn.com/2020/10/05/opinions/a-key-fix-for-an-unthinkable-election-disaster-hasen/index.html\">possible scenarios\u003c/a> should a candidate die.\u003c/p>\n\u003cp>There's much more certainty about what happens if the candidate dies between when Congress certifies the election and when he's sworn into office on January 20,2021. In that case, \u003ca href=\"https://constitutioncenter.org/interactive-constitution/amendment/amendment-xx\">under the 20th Amendment\u003c/a>, the vice president-elect will be sworn in as president.\u003c/p>\n\u003cp>Perhaps a more likely scenario this year is what would happen if the election results were contested in some states.\u003c/p>\n\u003cp>First, states have more than a month to count ballots, including the expected surge of mail-in ballots, and conduct recounts if necessary.\u003c/p>\n\u003cp>The courts will be mindful of when the electors meet in refereeing any disputes. For instance, during the 2000 election, the U.S. Supreme Court ultimately ended Florida’s vote recount, saying time had run out before electors were set to meet.\u003c/p>\n\u003cp>[aside tag=\"election-explainers\" label=\"related coverage\"]\u003c/p>\n\u003cp>If election issues still prevent a winner from being named, \u003ca href=\"https://constitutioncenter.org/interactive-constitution/amendment/amendment-xii\">the 12th Amendment kicks in\u003c/a>. Which says that, in that case, the House of Representatives elects the president and the Senate elects the vice president.\u003c/p>\n\u003cp>House members have to choose among the three people with the most electoral votes. Each state delegation gets one vote, and 26 votes are required to win. So California, with its 53-member delegation, has the same vote as Wyoming, which has one member.\u003c/p>\n\u003cp>In the Senate, the choice is between the top two electoral vote-getters and each senator gets a vote, with 51 votes required to win.\u003c/p>\n\u003cp>If there still isn't a president elected by Inauguration Day, then the 20th Amendment once again applies and the vice president-elect takes over.\u003c/p>\n\u003cp>No vice-president elect? Well, then the \u003ca href=\"https://www.law.cornell.edu/uscode/text/3/19\">Presidential Succession Act\u003c/a> applies.\u003c/p>\n\u003cp>It says that the speaker of the House of Representatives, the Senate president or a Cabinet officer — in that order — would act as president until there’s a president or vice president.\u003c/p>\n\u003cp>While these scenarios may seem far-fetched, they do raise several questions about the Electoral College and how it works. We try to answer some below.\u003c/p>\n\u003cp>[ad fullwidth]\u003c/p>\n\u003ch3>\u003cstrong>Who Are California's Electors?\u003c/strong>\u003c/h3>\n\u003cp>California gets 55 electoral votes, one for each of its U.S. senators and its 53 members of Congress. California has 55 electors, and they each get to cast two votes: one for president, one for vice president. The party whose candidate wins the popular vote in California gets to choose the electors, and \u003ca href=\"https://www.sos.ca.gov/elections/electoral-college/\" target=\"_blank\" rel=\"noopener noreferrer\">each has a different method\u003c/a>. \u003ca href=\"https://elections.cdn.sos.ca.gov/statewide-elections/2020-general/pres-elector-list.pdf\">Potential electors\u003c/a> must have been selected by October 1.\u003c/p>\n\u003ch3>\u003cstrong>Must Electors Vote for Whoever Won the Popular Vote in the State?\u003c/strong>\u003c/h3>\n\u003cp>California is among the 29 states and the District of Columbia that require electors to vote for the candidate who won the state's popular vote.\u003c/p>\n\u003cp>Generally electors are party loyalists who tend to support the winning candidate. Still, \u003ca href=\"http://www.socratek.com/StateLaws.aspx?id=840543&title=Electionsode&showall=true\" target=\"_blank\" rel=\"noopener noreferrer\">state election code\u003c/a> does compel them to vote for the popular vote winner. It reads: \"The electors, when convened, if both candidates are alive, shall vote by ballot for that person for President and that person for Vice President of the United States, who are, respectively, the candidates of the political party which they represent.\" Since the electors all represent the winning party, this ensures the candidate who won the popular vote will receive all the electoral votes.\u003c/p>\n\u003cp>In 2016, a California elector \u003ca href=\"http://www.politico.com/story/2016/12/california-elector-files-suit-joins-anti-trump-electoral-college-push-232472\" target=\"_blank\" rel=\"noopener noreferrer\">challenged the law\u003c/a> requiring electors to follow the popular vote. The legal challenge was called a last-ditch effort to block Donald Trump from getting enough electoral votes to win the presidency. However, earlier this year, the US Supreme Court \u003ca href=\"https://www.npr.org/2020/07/06/885168480/supreme-court-rules-state-faithless-elector-laws-constitutional\">unanimously upheld\u003c/a> such laws.\u003c/p>\n\u003ch3>\u003cstrong>How Do Electors Cast their Votes?\u003c/strong>\u003c/h3>\n\u003cp>The state code requires the designated electors to meet in Sacramento, \"at 2 o' clock in the afternoon on the first Monday after the second Wednesday in December next following their election.\"\u003c/p>\n\u003cp>The votes from all of the country's electors will be counted in a joint session of Congress on Jan. 6.\u003c/p>\n\u003cp>\u003cem>The Associated Press contributed to this report.\u003c/em>\u003c/p>\n\u003cp>\u003c/p>\n","blocks":[],"excerpt":"The president's recent illness has raised questions about the health of both nominees, who are each well into their 70's. So what would happen if the person who wins the election on November 3 passes away before they're sworn into office?","status":"publish","parent":0,"modified":1602714683,"stats":{"hasAudio":false,"hasVideo":false,"hasChartOrMap":false,"iframeSrcs":[],"hasGoogleForm":false,"hasGallery":false,"hasHearkenModule":false,"hasPolis":false,"paragraphCount":29,"wordCount":1016},"headData":{"title":"What Role Would California Play if the Election Outcome Gets Complicated? | KQED","description":"The president's recent illness has raised questions about the health of both nominees, who are each well into their 70's. So what would happen if the person who wins the election on November 3 passes away before they're sworn into office?","ogTitle":"","ogDescription":"","ogImgId":"","twTitle":"","twDescription":"","twImgId":"","schema":{"@context":"http://schema.org","@type":"NewsArticle","headline":"What Role Would California Play if the Election Outcome Gets Complicated?","datePublished":"2020-10-14T22:26:29.000Z","dateModified":"2020-10-14T22:31:23.000Z","image":"https://cdn.kqed.org/wp-content/uploads/2020/02/KQED-OG-Image@1x.png","isAccessibleForFree":"Y","publisher":{"@type":"NewsMediaOrganization","@id":"https://www.kqed.org/#organization","name":"KQED","url":"https://www.kqed.org","logo":"https://cdn.kqed.org/wp-content/uploads/2020/02/KQED-OG-Image@1x.png"}}},"disqusIdentifier":"11841961 https://ww2.kqed.org/news/?p=11841961","disqusUrl":"https://ww2.kqed.org/news/2020/10/14/what-role-would-california-play-if-the-election-outcome-gets-complicated/","disqusTitle":"What Role Would California Play if the Election Outcome Gets Complicated?","path":"/news/11841961/what-role-would-california-play-if-the-election-outcome-gets-complicated","audioTrackLength":null,"parsedContent":[{"type":"contentString","content":"\u003cdiv class=\"post-body\">\u003cp>\u003cp>The presidential election is just weeks away, and it's been a wild ride as COVID-19 has upended the traditional forms of campaigning.\u003c/p>\n\u003cp>Democratic nominee and former Vice President Joe Biden has opted for socially distanced and virtual events. He's generally seen wearing a mask unless he's speaking. By contrast, President Donald Trump moved forward with the large campaign rallies he prefers, often without wearing a mask. Earlier this month, \u003ca href=\"https://www.npr.org/sections/latest-updates-trump-covid-19-results/2020/10/03/919898777/timeline-what-we-know-of-president-trumps-covid-19-diagnosis\">Trump contracted COVID-19\u003c/a>, which resulted in a brief hospital stay.\u003c/p>\n\u003cp>While Trump maintains he's recovered, and Biden has not had the virus, the president's illness has raised questions about the health of both nominees, who are each well into their 70's: What happens if the person who wins the election on November 3 passes away before they're sworn into office? \u003c/p>\u003c/div>","attributes":{"named":{},"numeric":[]}},{"type":"component","content":"","name":"aside","attributes":{"named":{"tag":"election-2020","label":"more election coverage "},"numeric":[]}},{"type":"contentString","content":"\u003cdiv class=\"post-body\">\u003cp>\u003c/p>\n\u003cp>According to Jessica Levinson, Loyola Law School professor and host of the podcast \"Casting Judgement\", the election laws are a bit murky, but the answer largely depends on when the incident occurs.\u003c/p>\n\u003cp>The members of the Electoral College meet to cast their votes for president on December 14, 2020. Generally the party that won the popular vote in a state gets to pick that state's electors. But, if the winning candidate dies before the members meet, Levinson said the candidate's political party would choose a new nominee.\u003c/p>\n\u003cp>\"Either the Democratic National Committee or the Republican National Committee have procedures in place and they would pick a new nominee. And then, the idea is that the members of the Electoral College — because they are party loyalists — would vote for that (nominee),\" Levinson said.\u003c/p>\n\u003cp>But even once the Electoral College votes are cast, there's still potential for uncertainty. That's because Congress won't formally certify the election results until January 6, 2021.\u003c/p>\n\u003cp>\"It’s a mess in that period,\" said Richard Hasen in an email. He's a professor of law and political science at the University of California, Irvine, and has written about \u003ca href=\"https://www.cnn.com/2020/10/05/opinions/a-key-fix-for-an-unthinkable-election-disaster-hasen/index.html\">possible scenarios\u003c/a> should a candidate die.\u003c/p>\n\u003cp>There's much more certainty about what happens if the candidate dies between when Congress certifies the election and when he's sworn into office on January 20,2021. In that case, \u003ca href=\"https://constitutioncenter.org/interactive-constitution/amendment/amendment-xx\">under the 20th Amendment\u003c/a>, the vice president-elect will be sworn in as president.\u003c/p>\n\u003cp>Perhaps a more likely scenario this year is what would happen if the election results were contested in some states.\u003c/p>\n\u003cp>First, states have more than a month to count ballots, including the expected surge of mail-in ballots, and conduct recounts if necessary.\u003c/p>\n\u003cp>The courts will be mindful of when the electors meet in refereeing any disputes. For instance, during the 2000 election, the U.S. Supreme Court ultimately ended Florida’s vote recount, saying time had run out before electors were set to meet.\u003c/p>\n\u003cp>\u003c/p>\u003c/div>","attributes":{"named":{},"numeric":[]}},{"type":"component","content":"","name":"aside","attributes":{"named":{"tag":"election-explainers","label":"related coverage "},"numeric":[]}},{"type":"contentString","content":"\u003cdiv class=\"post-body\">\u003cp>\u003c/p>\n\u003cp>If election issues still prevent a winner from being named, \u003ca href=\"https://constitutioncenter.org/interactive-constitution/amendment/amendment-xii\">the 12th Amendment kicks in\u003c/a>. Which says that, in that case, the House of Representatives elects the president and the Senate elects the vice president.\u003c/p>\n\u003cp>House members have to choose among the three people with the most electoral votes. Each state delegation gets one vote, and 26 votes are required to win. So California, with its 53-member delegation, has the same vote as Wyoming, which has one member.\u003c/p>\n\u003cp>In the Senate, the choice is between the top two electoral vote-getters and each senator gets a vote, with 51 votes required to win.\u003c/p>\n\u003cp>If there still isn't a president elected by Inauguration Day, then the 20th Amendment once again applies and the vice president-elect takes over.\u003c/p>\n\u003cp>No vice-president elect? Well, then the \u003ca href=\"https://www.law.cornell.edu/uscode/text/3/19\">Presidential Succession Act\u003c/a> applies.\u003c/p>\n\u003cp>It says that the speaker of the House of Representatives, the Senate president or a Cabinet officer — in that order — would act as president until there’s a president or vice president.\u003c/p>\n\u003cp>While these scenarios may seem far-fetched, they do raise several questions about the Electoral College and how it works. We try to answer some below.\u003c/p>\n\u003cp>\u003c/p>\u003c/div>","attributes":{"named":{},"numeric":[]}},{"type":"component","content":"","name":"ad","attributes":{"named":{"label":"fullwidth"},"numeric":["fullwidth"]}},{"type":"contentString","content":"\u003cdiv class=\"post-body\">\u003cp>\u003c/p>\n\u003ch3>\u003cstrong>Who Are California's Electors?\u003c/strong>\u003c/h3>\n\u003cp>California gets 55 electoral votes, one for each of its U.S. senators and its 53 members of Congress. California has 55 electors, and they each get to cast two votes: one for president, one for vice president. The party whose candidate wins the popular vote in California gets to choose the electors, and \u003ca href=\"https://www.sos.ca.gov/elections/electoral-college/\" target=\"_blank\" rel=\"noopener noreferrer\">each has a different method\u003c/a>. \u003ca href=\"https://elections.cdn.sos.ca.gov/statewide-elections/2020-general/pres-elector-list.pdf\">Potential electors\u003c/a> must have been selected by October 1.\u003c/p>\n\u003ch3>\u003cstrong>Must Electors Vote for Whoever Won the Popular Vote in the State?\u003c/strong>\u003c/h3>\n\u003cp>California is among the 29 states and the District of Columbia that require electors to vote for the candidate who won the state's popular vote.\u003c/p>\n\u003cp>Generally electors are party loyalists who tend to support the winning candidate. Still, \u003ca href=\"http://www.socratek.com/StateLaws.aspx?id=840543&title=Electionsode&showall=true\" target=\"_blank\" rel=\"noopener noreferrer\">state election code\u003c/a> does compel them to vote for the popular vote winner. It reads: \"The electors, when convened, if both candidates are alive, shall vote by ballot for that person for President and that person for Vice President of the United States, who are, respectively, the candidates of the political party which they represent.\" Since the electors all represent the winning party, this ensures the candidate who won the popular vote will receive all the electoral votes.\u003c/p>\n\u003cp>In 2016, a California elector \u003ca href=\"http://www.politico.com/story/2016/12/california-elector-files-suit-joins-anti-trump-electoral-college-push-232472\" target=\"_blank\" rel=\"noopener noreferrer\">challenged the law\u003c/a> requiring electors to follow the popular vote. The legal challenge was called a last-ditch effort to block Donald Trump from getting enough electoral votes to win the presidency. However, earlier this year, the US Supreme Court \u003ca href=\"https://www.npr.org/2020/07/06/885168480/supreme-court-rules-state-faithless-elector-laws-constitutional\">unanimously upheld\u003c/a> such laws.\u003c/p>\n\u003ch3>\u003cstrong>How Do Electors Cast their Votes?\u003c/strong>\u003c/h3>\n\u003cp>The state code requires the designated electors to meet in Sacramento, \"at 2 o' clock in the afternoon on the first Monday after the second Wednesday in December next following their election.\"\u003c/p>\n\u003cp>The votes from all of the country's electors will be counted in a joint session of Congress on Jan. 6.\u003c/p>\n\u003cp>\u003cem>The Associated Press contributed to this report.\u003c/em>\u003c/p>\n\u003cp>\u003c/p>\n\u003c/div>\u003c/p>","attributes":{"named":{},"numeric":[]}}],"link":"/news/11841961/what-role-would-california-play-if-the-election-outcome-gets-complicated","authors":["11200"],"programs":["news_6944","news_72"],"series":["news_19101"],"categories":["news_6188","news_8","news_13"],"tags":["news_1323","news_27370","news_20302","news_717","news_17286"],"featImg":"news_11223334","label":"news_72"},"news_11835767":{"type":"posts","id":"news_11835767","meta":{"index":"posts_1591205157","site":"news","id":"11835767","score":null,"sort":[1598652977000]},"guestAuthors":[],"slug":"what-am-i-going-to-do-for-families-losing-wages-bay-area-rents-are-now-a-crisis","title":"‘What Am I Going to Do?' For Families Losing Wages, Bay Area Rents Are Now a Crisis","publishDate":1598652977,"format":"standard","headTitle":"News Fix | KQED News","labelTerm":{"term":6944,"site":"news"},"content":"\u003cp>Aleyda Rebelo hasn’t slept well since the pandemic began.\u003c/p>\n\u003cp>Many nights, she tosses and turns in bed, anxious about how she’ll pay the $1,200 monthly rent on the house she shares with her family in Oakland’s Fruitvale neighborhood.\u003c/p>\n\u003cp>\"I’m so worried because my family depends on me. If I don’t make money, it’s very difficult,\" said Rebelo, 35, in Spanish.\u003c/p>\n\u003cp>The mother of four became the main breadwinner in her household about five years ago, she said, after her husband was disabled at his last job.\u003c/p>\n\u003cp>Rebelo cleans homes in San Francisco and the Oakland hills but, since March, she has lost several clients and more than half of her earnings, she said.\u003c/p>\n\u003cp>Rebelo is one of hundreds of thousands of Bay Area \u003ca href=\"https://ternercenter.berkeley.edu/blog/covid-19-and-vulnerable-renters-california\">renters who saw their incomes drop\u003c/a> during the pandemic, as shelter-in-place and social distancing measures became the norm. The economic slowdown has compounded the stress on families for whom the regional housing market was already unaffordable — and the strain is felt especially in lower-income areas like Fruitvale.\u003c/p>\n\u003cp>At the same time, the health of people in the neighborhood has been battered by the coronavirus. A cluster of three ZIP codes there, including 94601 — where Rebelo lives — has the highest case rates of COVID-19 in Alameda County, according to its\u003ca href=\"https://covid-19.acgov.org/data.page?\"> public health department\u003c/a>.\u003c/p>\n\u003cfigure id=\"attachment_11835785\" class=\"wp-caption alignnone\" style=\"max-width: 1920px\">\u003cimg class=\"size-full wp-image-11835785\" src=\"https://ww2.kqed.org/app/uploads/sites/10/2020/08/RS44635_013_KQED_Oakland_AleydaRebelo_08262020-qut.jpg\" alt=\"\" width=\"1920\" height=\"1280\" srcset=\"https://ww2.kqed.org/app/uploads/sites/10/2020/08/RS44635_013_KQED_Oakland_AleydaRebelo_08262020-qut.jpg 1920w, https://ww2.kqed.org/app/uploads/sites/10/2020/08/RS44635_013_KQED_Oakland_AleydaRebelo_08262020-qut-800x533.jpg 800w, https://ww2.kqed.org/app/uploads/sites/10/2020/08/RS44635_013_KQED_Oakland_AleydaRebelo_08262020-qut-1020x680.jpg 1020w, https://ww2.kqed.org/app/uploads/sites/10/2020/08/RS44635_013_KQED_Oakland_AleydaRebelo_08262020-qut-160x107.jpg 160w, https://ww2.kqed.org/app/uploads/sites/10/2020/08/RS44635_013_KQED_Oakland_AleydaRebelo_08262020-qut-1536x1024.jpg 1536w\" sizes=\"(max-width: 1920px) 100vw, 1920px\">\u003cfigcaption class=\"wp-caption-text\">Aleyda Rebelo at her home in Oakland on Aug. 26, 2020. \u003ccite>(Beth LaBerge/KQED)\u003c/cite>\u003c/figcaption>\u003c/figure>\n\u003cp>\u003cspan style=\"font-weight: 400;\">[pullquote size='medium' align='right' citation=\"Aleyda Rebelo\"]'I’m so worried because my family depends on me.'[/pullquote]\u003c/span>\u003c/p>\n\u003cp>Rebelo said her 2-year-old niece, whose family lives in the neighborhood, tested positive for COVID-19 this month. And Rebelo worries about bringing the virus home to her husband, who she said suffered lung damage by inhaling chemicals used to treat wood floors at his job.\u003c/p>\n\u003cp>\"If my husband gets the virus he could die, because he already has a more delicate health condition,\" said Rebelo, an immigrant from El Salvador. \"So, it’s a huge stress having to go out.\"\u003c/p>\n\u003cp>Like Rebelo, most of the residents in ZIP code 94601 work in jobs that can’t be done from home, so they are at higher risk for contracting the virus. And wages for Rebelo and her neighbors tend to be low.\u003c/p>\n\u003cp>As a consequence, more than 28% of people in the ZIP code live in poverty — twice the state average, \u003ca href=\"https://censusreporter.org/profiles/86000US94601-94601/\">according to census figures\u003c/a>.\u003c/p>\n\u003ch3>'We’ve Just Seen the Need Intensify'\u003c/h3>\n\u003cp>Even before the pandemic, many in Fruitvale and adjacent parts of East Oakland were already spending a big share of their paychecks on rent and had no financial cushion to cope with lost income, said Carolina Reid, an assistant professor in city and regional planning at UC Berkeley.\u003c/p>\n\u003cp>\"It’s hard to come up with the words that are sufficient to describe what a crisis this must be for some households in terms of concerns over their health ... concerns over paying rent,\" said Reid, a researcher at UC Berkeley’s \u003ca href=\"https://ternercenter.berkeley.edu\">Terner Center for Housing Innovation\u003c/a>.\u003c/p>\n\u003cfigure id=\"attachment_11835784\" class=\"wp-caption alignnone\" style=\"max-width: 1920px\">\u003cimg class=\"size-full wp-image-11835784\" src=\"https://ww2.kqed.org/app/uploads/sites/10/2020/08/RS44627_005_KQED_Oakland_AleydaRebelo_08262020-qut.jpg\" alt=\"\" width=\"1920\" height=\"1280\" srcset=\"https://ww2.kqed.org/app/uploads/sites/10/2020/08/RS44627_005_KQED_Oakland_AleydaRebelo_08262020-qut.jpg 1920w, https://ww2.kqed.org/app/uploads/sites/10/2020/08/RS44627_005_KQED_Oakland_AleydaRebelo_08262020-qut-800x533.jpg 800w, https://ww2.kqed.org/app/uploads/sites/10/2020/08/RS44627_005_KQED_Oakland_AleydaRebelo_08262020-qut-1020x680.jpg 1020w, https://ww2.kqed.org/app/uploads/sites/10/2020/08/RS44627_005_KQED_Oakland_AleydaRebelo_08262020-qut-160x107.jpg 160w, https://ww2.kqed.org/app/uploads/sites/10/2020/08/RS44627_005_KQED_Oakland_AleydaRebelo_08262020-qut-1536x1024.jpg 1536w\" sizes=\"(max-width: 1920px) 100vw, 1920px\">\u003cfigcaption class=\"wp-caption-text\">Raphael, 3, Jessalyn, 2, and Genesis 7, play outside of the home of Aleyda Rebelo in Oakland on Aug. 26, 2020. \u003ccite>(Beth LaBerge/KQED)\u003c/cite>\u003c/figcaption>\u003c/figure>\n\u003cp>For now, local and state eviction moratoriums have been a lifeline for renters like Rebelo. But once those policies end, tenants may still have to pay landlords the full amount of their back rent.\u003c/p>\n\u003cp>Reid and others worry that could lead to an unprecedented wave of evictions, especially hitting low-income renters of color. As many as 5.4 million people in California are at risk of eviction, according to \u003ca href=\"https://www.aspeninstitute.org/blog-posts/the-covid-19-eviction-crisis-an-estimated-30-40-million-people-in-america-are-at-risk/\">estimates by the Aspen Institute\u003c/a>.\u003c/p>\n\u003cp>\u003cspan style=\"font-weight: 400;\">[pullquote size='medium' align='right' citation=\"Carolina Reid, UC Berkeley.\"]'It’s hard to come up with the words that are sufficient to describe what a crisis this must be for some households.'[/pullquote]\u003c/span>\u003c/p>\n\u003cp>\"It's going to increase homelessness and it's also going to have an impact on our ability to have economic recovery,\" Reid said. \"We are in for a prolonged recession, if not worse, if we can't get people back on their feet.\"\u003c/p>\n\u003cp>To avoid massive evictions, Reid said, the federal government must continue to provide cash assistance to people who’ve been financially hurt by the pandemic, so they can pay for rent, groceries and other basic needs — and help keep the larger economy afloat.\u003c/p>\n\u003cp>On Friday, Gov. Gavin Newsom \u003ca href=\"https://www.kqed.org/news/11835565/newsom-announces-new-statewide-eviction-moratorium-but-major-concessions-may-threaten-tenants\">announced a plan for a new eviction moratorium\u003c/a> that could protect millions of renters in the state, if the Legislature approves it.\u003c/p>\n\u003cp>[aside postID=\"news_11812172\" label=\"Pandemic finance resources\"]\u003c/p>\n\u003cp>Though the bill, Assembly Bill 3088, does not go as far as tenants’ groups had hoped, it would prevent landlords from evicting tenants for missing rent between March 1 and Aug. 31. Unpaid rent from that period would be converted to civil debt, meaning landlords could take tenants to small claims court to try to recover the amount.\u003c/p>\n\u003cp>For rents missed between Sept. 1 and Jan. 31, tenants would have to pay at least 25% of what they owe or face eviction. The remaining amount would be converted to civil debt.\u003c/p>\n\u003cfigure id=\"attachment_11835786\" class=\"wp-caption alignnone\" style=\"max-width: 1920px\">\u003cimg class=\"size-full wp-image-11835786\" src=\"https://ww2.kqed.org/app/uploads/sites/10/2020/08/RS44624_002_KQED_Oakland_AleydaRebelo_08262020-qut-1.jpg\" alt=\"\" width=\"1920\" height=\"1280\" srcset=\"https://ww2.kqed.org/app/uploads/sites/10/2020/08/RS44624_002_KQED_Oakland_AleydaRebelo_08262020-qut-1.jpg 1920w, https://ww2.kqed.org/app/uploads/sites/10/2020/08/RS44624_002_KQED_Oakland_AleydaRebelo_08262020-qut-1-800x533.jpg 800w, https://ww2.kqed.org/app/uploads/sites/10/2020/08/RS44624_002_KQED_Oakland_AleydaRebelo_08262020-qut-1-1020x680.jpg 1020w, https://ww2.kqed.org/app/uploads/sites/10/2020/08/RS44624_002_KQED_Oakland_AleydaRebelo_08262020-qut-1-160x107.jpg 160w, https://ww2.kqed.org/app/uploads/sites/10/2020/08/RS44624_002_KQED_Oakland_AleydaRebelo_08262020-qut-1-1536x1024.jpg 1536w\" sizes=\"(max-width: 1920px) 100vw, 1920px\">\u003cfigcaption class=\"wp-caption-text\">Christopher, 12, and Raphael, 3, the children of Aleyda Rebelo, play basketball outside of their home in Oakland on Aug. 26, 2020.\u003c/figcaption>\u003c/figure>\n\u003cp>Meanwhile, in Oakland, a program called \u003ca href=\"https://www.keepoaklandhoused.org\">Keep Oakland Housed\u003c/a> has been channeling private donations to provide emergency assistance to people in need.\u003c/p>\n\u003cp>The program has been around for two years, but since the pandemic started it has received hundreds more calls for help, said Jonathan Russell, who directs housing strategy for Bay Area Community Services, one the nonprofits that run it.\u003c/p>\n\u003cp>\"We’ve just seen the need intensify,\" Russell said. \"What was already an extremely difficult and expensive market ... we've just seen that exacerbated and worsened.\"\u003c/p>\n\u003cp>\u003cspan style=\"font-weight: 400;\">[ad fullwidth]\u003c/span>\u003c/p>\n\u003ch3>\"What Am I Going to Do?\"\u003c/h3>\n\u003cp>The Keep Oakland Housed program helped Aleyda Rebelo pay a PG&E bill, car repairs and more than $4,000 in rent payments on her family's Fruitvale home that she had missed from May to August.\u003c/p>\n\u003cp>\"The reality is, it doesn't fix September,\" Russell said of the aid Rebelo received. \"But it puts September in a context where the burden of rent — that would otherwise compound in the future — is gone. And the car is working.\"\u003c/p>\n\u003cfigure id=\"attachment_11835804\" class=\"wp-caption alignnone\" style=\"max-width: 1920px\">\u003cimg class=\"size-full wp-image-11835804\" src=\"https://ww2.kqed.org/app/uploads/sites/10/2020/08/RS44636_014_KQED_Oakland_AleydaRebelo_08262020-qut.jpg\" alt=\"\" width=\"1920\" height=\"1280\" srcset=\"https://ww2.kqed.org/app/uploads/sites/10/2020/08/RS44636_014_KQED_Oakland_AleydaRebelo_08262020-qut.jpg 1920w, https://ww2.kqed.org/app/uploads/sites/10/2020/08/RS44636_014_KQED_Oakland_AleydaRebelo_08262020-qut-800x533.jpg 800w, https://ww2.kqed.org/app/uploads/sites/10/2020/08/RS44636_014_KQED_Oakland_AleydaRebelo_08262020-qut-1020x680.jpg 1020w, https://ww2.kqed.org/app/uploads/sites/10/2020/08/RS44636_014_KQED_Oakland_AleydaRebelo_08262020-qut-160x107.jpg 160w, https://ww2.kqed.org/app/uploads/sites/10/2020/08/RS44636_014_KQED_Oakland_AleydaRebelo_08262020-qut-1536x1024.jpg 1536w\" sizes=\"(max-width: 1920px) 100vw, 1920px\">\u003cfigcaption class=\"wp-caption-text\">Aleyda Rebelo and her son Raphael Roque, 3, at their home in Oakland on Aug. 26, 2020. \u003ccite>(Beth LaBerge/KQED)\u003c/cite>\u003c/figcaption>\u003c/figure>\n\u003cp>Rebelo said the financial help was a huge relief that gave her and her family an emotional and financial break during the crisis.\u003c/p>\n\u003cp>But many others she knows who have lost jobs, like her sister, haven’t been able to find help, she said. And Rebelo is still anxious, because she doesn’t know when she’ll be able to work full time again to cover her rent and bills.\u003c/p>\n\u003cp>\"I still don’t have all my work, the way I had it before the pandemic,” she said. \"And it’s like, what am I going to do?\"\u003c/p>\n\u003cp>[ad floatright]\u003c/p>\n","blocks":[],"excerpt":"With no financial cushion, eviction is a real fear for Aleyda Rebelo and other low-wage workers in places like Oakland's Fruitvale neighborhood.","status":"publish","parent":0,"modified":1598662502,"stats":{"hasAudio":false,"hasVideo":false,"hasChartOrMap":false,"iframeSrcs":[],"hasGoogleForm":false,"hasGallery":false,"hasHearkenModule":false,"hasPolis":false,"paragraphCount":33,"wordCount":1198},"headData":{"title":"‘What Am I Going to Do?' For Families Losing Wages, Bay Area Rents Are Now a Crisis | KQED","description":"With no financial cushion, eviction is a real fear for Aleyda Rebelo and other low-wage workers in places like Oakland's Fruitvale neighborhood.","ogTitle":"","ogDescription":"","ogImgId":"","twTitle":"","twDescription":"","twImgId":"","schema":{"@context":"http://schema.org","@type":"NewsArticle","headline":"‘What Am I Going to Do?' For Families Losing Wages, Bay Area Rents Are Now a Crisis","datePublished":"2020-08-28T22:16:17.000Z","dateModified":"2020-08-29T00:55:02.000Z","image":"https://cdn.kqed.org/wp-content/uploads/2020/02/KQED-OG-Image@1x.png","isAccessibleForFree":"Y","publisher":{"@type":"NewsMediaOrganization","@id":"https://www.kqed.org/#organization","name":"KQED","url":"https://www.kqed.org","logo":"https://cdn.kqed.org/wp-content/uploads/2020/02/KQED-OG-Image@1x.png"}}},"disqusIdentifier":"11835767 https://ww2.kqed.org/news/?p=11835767","disqusUrl":"https://ww2.kqed.org/news/2020/08/28/what-am-i-going-to-do-for-families-losing-wages-bay-area-rents-are-now-a-crisis/","disqusTitle":"‘What Am I Going to Do?' For Families Losing Wages, Bay Area Rents Are Now a Crisis","audioUrl":"https://traffic.omny.fm/d/clips/0af137ef-751e-4b19-a055-aaef00d2d578/ffca7e9f-6831-41c5-bcaf-aaef00f5a073/9d04cd18-24dc-4572-a2e2-ac2401289cc0/audio.mp3","path":"/news/11835767/what-am-i-going-to-do-for-families-losing-wages-bay-area-rents-are-now-a-crisis","audioTrackLength":null,"parsedContent":[{"type":"contentString","content":"\u003cdiv class=\"post-body\">\u003cp>\u003cp>Aleyda Rebelo hasn’t slept well since the pandemic began.\u003c/p>\n\u003cp>Many nights, she tosses and turns in bed, anxious about how she’ll pay the $1,200 monthly rent on the house she shares with her family in Oakland’s Fruitvale neighborhood.\u003c/p>\n\u003cp>\"I’m so worried because my family depends on me. If I don’t make money, it’s very difficult,\" said Rebelo, 35, in Spanish.\u003c/p>\n\u003cp>The mother of four became the main breadwinner in her household about five years ago, she said, after her husband was disabled at his last job.\u003c/p>\n\u003cp>Rebelo cleans homes in San Francisco and the Oakland hills but, since March, she has lost several clients and more than half of her earnings, she said.\u003c/p>\n\u003cp>Rebelo is one of hundreds of thousands of Bay Area \u003ca href=\"https://ternercenter.berkeley.edu/blog/covid-19-and-vulnerable-renters-california\">renters who saw their incomes drop\u003c/a> during the pandemic, as shelter-in-place and social distancing measures became the norm. The economic slowdown has compounded the stress on families for whom the regional housing market was already unaffordable — and the strain is felt especially in lower-income areas like Fruitvale.\u003c/p>\n\u003cp>At the same time, the health of people in the neighborhood has been battered by the coronavirus. A cluster of three ZIP codes there, including 94601 — where Rebelo lives — has the highest case rates of COVID-19 in Alameda County, according to its\u003ca href=\"https://covid-19.acgov.org/data.page?\"> public health department\u003c/a>.\u003c/p>\n\u003cfigure id=\"attachment_11835785\" class=\"wp-caption alignnone\" style=\"max-width: 1920px\">\u003cimg class=\"size-full wp-image-11835785\" src=\"https://ww2.kqed.org/app/uploads/sites/10/2020/08/RS44635_013_KQED_Oakland_AleydaRebelo_08262020-qut.jpg\" alt=\"\" width=\"1920\" height=\"1280\" srcset=\"https://ww2.kqed.org/app/uploads/sites/10/2020/08/RS44635_013_KQED_Oakland_AleydaRebelo_08262020-qut.jpg 1920w, https://ww2.kqed.org/app/uploads/sites/10/2020/08/RS44635_013_KQED_Oakland_AleydaRebelo_08262020-qut-800x533.jpg 800w, https://ww2.kqed.org/app/uploads/sites/10/2020/08/RS44635_013_KQED_Oakland_AleydaRebelo_08262020-qut-1020x680.jpg 1020w, https://ww2.kqed.org/app/uploads/sites/10/2020/08/RS44635_013_KQED_Oakland_AleydaRebelo_08262020-qut-160x107.jpg 160w, https://ww2.kqed.org/app/uploads/sites/10/2020/08/RS44635_013_KQED_Oakland_AleydaRebelo_08262020-qut-1536x1024.jpg 1536w\" sizes=\"(max-width: 1920px) 100vw, 1920px\">\u003cfigcaption class=\"wp-caption-text\">Aleyda Rebelo at her home in Oakland on Aug. 26, 2020. \u003ccite>(Beth LaBerge/KQED)\u003c/cite>\u003c/figcaption>\u003c/figure>\n\u003cp>\u003cspan style=\"font-weight: 400;\">\u003c/p>\u003c/div>","attributes":{"named":{},"numeric":[]}},{"type":"component","content":"'I’m so worried because my family depends on me.'","name":"pullquote","attributes":{"named":{"size":"medium","align":"right","citation":"Aleyda Rebelo","label":""},"numeric":[]}},{"type":"contentString","content":"\u003cdiv class=\"post-body\">\u003cp>\u003c/span>\u003c/p>\n\u003cp>Rebelo said her 2-year-old niece, whose family lives in the neighborhood, tested positive for COVID-19 this month. And Rebelo worries about bringing the virus home to her husband, who she said suffered lung damage by inhaling chemicals used to treat wood floors at his job.\u003c/p>\n\u003cp>\"If my husband gets the virus he could die, because he already has a more delicate health condition,\" said Rebelo, an immigrant from El Salvador. \"So, it’s a huge stress having to go out.\"\u003c/p>\n\u003cp>Like Rebelo, most of the residents in ZIP code 94601 work in jobs that can’t be done from home, so they are at higher risk for contracting the virus. And wages for Rebelo and her neighbors tend to be low.\u003c/p>\n\u003cp>As a consequence, more than 28% of people in the ZIP code live in poverty — twice the state average, \u003ca href=\"https://censusreporter.org/profiles/86000US94601-94601/\">according to census figures\u003c/a>.\u003c/p>\n\u003ch3>'We’ve Just Seen the Need Intensify'\u003c/h3>\n\u003cp>Even before the pandemic, many in Fruitvale and adjacent parts of East Oakland were already spending a big share of their paychecks on rent and had no financial cushion to cope with lost income, said Carolina Reid, an assistant professor in city and regional planning at UC Berkeley.\u003c/p>\n\u003cp>\"It’s hard to come up with the words that are sufficient to describe what a crisis this must be for some households in terms of concerns over their health ... concerns over paying rent,\" said Reid, a researcher at UC Berkeley’s \u003ca href=\"https://ternercenter.berkeley.edu\">Terner Center for Housing Innovation\u003c/a>.\u003c/p>\n\u003cfigure id=\"attachment_11835784\" class=\"wp-caption alignnone\" style=\"max-width: 1920px\">\u003cimg class=\"size-full wp-image-11835784\" src=\"https://ww2.kqed.org/app/uploads/sites/10/2020/08/RS44627_005_KQED_Oakland_AleydaRebelo_08262020-qut.jpg\" alt=\"\" width=\"1920\" height=\"1280\" srcset=\"https://ww2.kqed.org/app/uploads/sites/10/2020/08/RS44627_005_KQED_Oakland_AleydaRebelo_08262020-qut.jpg 1920w, https://ww2.kqed.org/app/uploads/sites/10/2020/08/RS44627_005_KQED_Oakland_AleydaRebelo_08262020-qut-800x533.jpg 800w, https://ww2.kqed.org/app/uploads/sites/10/2020/08/RS44627_005_KQED_Oakland_AleydaRebelo_08262020-qut-1020x680.jpg 1020w, https://ww2.kqed.org/app/uploads/sites/10/2020/08/RS44627_005_KQED_Oakland_AleydaRebelo_08262020-qut-160x107.jpg 160w, https://ww2.kqed.org/app/uploads/sites/10/2020/08/RS44627_005_KQED_Oakland_AleydaRebelo_08262020-qut-1536x1024.jpg 1536w\" sizes=\"(max-width: 1920px) 100vw, 1920px\">\u003cfigcaption class=\"wp-caption-text\">Raphael, 3, Jessalyn, 2, and Genesis 7, play outside of the home of Aleyda Rebelo in Oakland on Aug. 26, 2020. \u003ccite>(Beth LaBerge/KQED)\u003c/cite>\u003c/figcaption>\u003c/figure>\n\u003cp>For now, local and state eviction moratoriums have been a lifeline for renters like Rebelo. But once those policies end, tenants may still have to pay landlords the full amount of their back rent.\u003c/p>\n\u003cp>Reid and others worry that could lead to an unprecedented wave of evictions, especially hitting low-income renters of color. As many as 5.4 million people in California are at risk of eviction, according to \u003ca href=\"https://www.aspeninstitute.org/blog-posts/the-covid-19-eviction-crisis-an-estimated-30-40-million-people-in-america-are-at-risk/\">estimates by the Aspen Institute\u003c/a>.\u003c/p>\n\u003cp>\u003cspan style=\"font-weight: 400;\">\u003c/p>\u003c/div>","attributes":{"named":{},"numeric":[]}},{"type":"component","content":"'It’s hard to come up with the words that are sufficient to describe what a crisis this must be for some households.'","name":"pullquote","attributes":{"named":{"size":"medium","align":"right","citation":"Carolina Reid, UC Berkeley.","label":""},"numeric":[]}},{"type":"contentString","content":"\u003cdiv class=\"post-body\">\u003cp>\u003c/span>\u003c/p>\n\u003cp>\"It's going to increase homelessness and it's also going to have an impact on our ability to have economic recovery,\" Reid said. \"We are in for a prolonged recession, if not worse, if we can't get people back on their feet.\"\u003c/p>\n\u003cp>To avoid massive evictions, Reid said, the federal government must continue to provide cash assistance to people who’ve been financially hurt by the pandemic, so they can pay for rent, groceries and other basic needs — and help keep the larger economy afloat.\u003c/p>\n\u003cp>On Friday, Gov. Gavin Newsom \u003ca href=\"https://www.kqed.org/news/11835565/newsom-announces-new-statewide-eviction-moratorium-but-major-concessions-may-threaten-tenants\">announced a plan for a new eviction moratorium\u003c/a> that could protect millions of renters in the state, if the Legislature approves it.\u003c/p>\n\u003cp>\u003c/p>\u003c/div>","attributes":{"named":{},"numeric":[]}},{"type":"component","content":"","name":"aside","attributes":{"named":{"postid":"news_11812172","label":"Pandemic finance resources "},"numeric":[]}},{"type":"contentString","content":"\u003cdiv class=\"post-body\">\u003cp>\u003c/p>\n\u003cp>Though the bill, Assembly Bill 3088, does not go as far as tenants’ groups had hoped, it would prevent landlords from evicting tenants for missing rent between March 1 and Aug. 31. Unpaid rent from that period would be converted to civil debt, meaning landlords could take tenants to small claims court to try to recover the amount.\u003c/p>\n\u003cp>For rents missed between Sept. 1 and Jan. 31, tenants would have to pay at least 25% of what they owe or face eviction. The remaining amount would be converted to civil debt.\u003c/p>\n\u003cfigure id=\"attachment_11835786\" class=\"wp-caption alignnone\" style=\"max-width: 1920px\">\u003cimg class=\"size-full wp-image-11835786\" src=\"https://ww2.kqed.org/app/uploads/sites/10/2020/08/RS44624_002_KQED_Oakland_AleydaRebelo_08262020-qut-1.jpg\" alt=\"\" width=\"1920\" height=\"1280\" srcset=\"https://ww2.kqed.org/app/uploads/sites/10/2020/08/RS44624_002_KQED_Oakland_AleydaRebelo_08262020-qut-1.jpg 1920w, https://ww2.kqed.org/app/uploads/sites/10/2020/08/RS44624_002_KQED_Oakland_AleydaRebelo_08262020-qut-1-800x533.jpg 800w, https://ww2.kqed.org/app/uploads/sites/10/2020/08/RS44624_002_KQED_Oakland_AleydaRebelo_08262020-qut-1-1020x680.jpg 1020w, https://ww2.kqed.org/app/uploads/sites/10/2020/08/RS44624_002_KQED_Oakland_AleydaRebelo_08262020-qut-1-160x107.jpg 160w, https://ww2.kqed.org/app/uploads/sites/10/2020/08/RS44624_002_KQED_Oakland_AleydaRebelo_08262020-qut-1-1536x1024.jpg 1536w\" sizes=\"(max-width: 1920px) 100vw, 1920px\">\u003cfigcaption class=\"wp-caption-text\">Christopher, 12, and Raphael, 3, the children of Aleyda Rebelo, play basketball outside of their home in Oakland on Aug. 26, 2020.\u003c/figcaption>\u003c/figure>\n\u003cp>Meanwhile, in Oakland, a program called \u003ca href=\"https://www.keepoaklandhoused.org\">Keep Oakland Housed\u003c/a> has been channeling private donations to provide emergency assistance to people in need.\u003c/p>\n\u003cp>The program has been around for two years, but since the pandemic started it has received hundreds more calls for help, said Jonathan Russell, who directs housing strategy for Bay Area Community Services, one the nonprofits that run it.\u003c/p>\n\u003cp>\"We’ve just seen the need intensify,\" Russell said. \"What was already an extremely difficult and expensive market ... we've just seen that exacerbated and worsened.\"\u003c/p>\n\u003cp>\u003cspan style=\"font-weight: 400;\">\u003c/p>\u003c/div>","attributes":{"named":{},"numeric":[]}},{"type":"component","content":"","name":"ad","attributes":{"named":{"label":"fullwidth"},"numeric":["fullwidth"]}},{"type":"contentString","content":"\u003cdiv class=\"post-body\">\u003cp>\u003c/span>\u003c/p>\n\u003ch3>\"What Am I Going to Do?\"\u003c/h3>\n\u003cp>The Keep Oakland Housed program helped Aleyda Rebelo pay a PG&E bill, car repairs and more than $4,000 in rent payments on her family's Fruitvale home that she had missed from May to August.\u003c/p>\n\u003cp>\"The reality is, it doesn't fix September,\" Russell said of the aid Rebelo received. \"But it puts September in a context where the burden of rent — that would otherwise compound in the future — is gone. And the car is working.\"\u003c/p>\n\u003cfigure id=\"attachment_11835804\" class=\"wp-caption alignnone\" style=\"max-width: 1920px\">\u003cimg class=\"size-full wp-image-11835804\" src=\"https://ww2.kqed.org/app/uploads/sites/10/2020/08/RS44636_014_KQED_Oakland_AleydaRebelo_08262020-qut.jpg\" alt=\"\" width=\"1920\" height=\"1280\" srcset=\"https://ww2.kqed.org/app/uploads/sites/10/2020/08/RS44636_014_KQED_Oakland_AleydaRebelo_08262020-qut.jpg 1920w, https://ww2.kqed.org/app/uploads/sites/10/2020/08/RS44636_014_KQED_Oakland_AleydaRebelo_08262020-qut-800x533.jpg 800w, https://ww2.kqed.org/app/uploads/sites/10/2020/08/RS44636_014_KQED_Oakland_AleydaRebelo_08262020-qut-1020x680.jpg 1020w, https://ww2.kqed.org/app/uploads/sites/10/2020/08/RS44636_014_KQED_Oakland_AleydaRebelo_08262020-qut-160x107.jpg 160w, https://ww2.kqed.org/app/uploads/sites/10/2020/08/RS44636_014_KQED_Oakland_AleydaRebelo_08262020-qut-1536x1024.jpg 1536w\" sizes=\"(max-width: 1920px) 100vw, 1920px\">\u003cfigcaption class=\"wp-caption-text\">Aleyda Rebelo and her son Raphael Roque, 3, at their home in Oakland on Aug. 26, 2020. \u003ccite>(Beth LaBerge/KQED)\u003c/cite>\u003c/figcaption>\u003c/figure>\n\u003cp>Rebelo said the financial help was a huge relief that gave her and her family an emotional and financial break during the crisis.\u003c/p>\n\u003cp>But many others she knows who have lost jobs, like her sister, haven’t been able to find help, she said. And Rebelo is still anxious, because she doesn’t know when she’ll be able to work full time again to cover her rent and bills.\u003c/p>\n\u003cp>\"I still don’t have all my work, the way I had it before the pandemic,” she said. \"And it’s like, what am I going to do?\"\u003c/p>\n\u003cp>\u003c/p>\u003c/div>","attributes":{"named":{},"numeric":[]}},{"type":"component","content":"","name":"ad","attributes":{"named":{"label":"floatright"},"numeric":["floatright"]}},{"type":"contentString","content":"\u003cdiv class=\"post-body\">\u003cp>\u003c/p>\n\u003c/div>\u003c/p>","attributes":{"named":{},"numeric":[]}}],"link":"/news/11835767/what-am-i-going-to-do-for-families-losing-wages-bay-area-rents-are-now-a-crisis","authors":["8659"],"programs":["news_6944"],"categories":["news_1758","news_6266","news_1169","news_8"],"tags":["news_24805","news_27350","news_27504","news_21883","news_27701","news_27626","news_85","news_1775","news_27208","news_21358","news_20265","news_17708","news_28465","news_18","news_27707","news_3733"],"featImg":"news_11835783","label":"news_6944"},"news_11827388":{"type":"posts","id":"news_11827388","meta":{"index":"posts_1591205157","site":"news","id":"11827388","score":null,"sort":[1593784834000]},"guestAuthors":[],"slug":"cambodian-refugee-leaves-san-quentin-with-covid-19-but-avoids-ice-detention","title":"Cambodian Refugee Leaves San Quentin With COVID-19 But Avoids ICE Detention","publishDate":1593784834,"format":"audio","headTitle":"The California Report | KQED News","labelTerm":{},"content":"\u003cp>Chanthon Bun, a Cambodian refugee, was released from San Quentin State Prison Wednesday to two unexpected discoveries: he was not turned over to immigration officials for deportation, as he had feared, but he was infected with COVID-19, along with more than 1,000 others at San Quentin.\u003c/p>\n\u003cp>Bun, 41, was greeted at the prison gates in Marin County by friends and supporters who helped secure his release. According to Bun’s lawyer, Anoop Prasad with San Francisco’s \u003ca href=\"https://www.advancingjustice-alc.org\">Asian Law Caucus\u003c/a> Bun served 23 years for an armed robbery committed when he was 18. Friends took Bun to get a coronavirus test, since the disease has \u003ca href=\"https://www.kqed.org/news/11826530/incarceration-should-not-mean-a-death-sentence-advocates-want-a-plan-to-stop-covid-19-spread-in-san-quentin\">swept through San Quentin\u003c/a> in recent weeks, and Bun tested positive. By Wednesday night, he had spiked a fever, Prasad said.\u003c/p>\n\u003cfigure id=\"attachment_11827397\" class=\"wp-caption alignnone\" style=\"max-width: 800px\">\u003cimg class=\"size-medium wp-image-11827397\" src=\"https://ww2.kqed.org/app/uploads/sites/10/2020/07/7599343071984525152-800x600.jpg\" alt=\"\" width=\"800\" height=\"600\" srcset=\"https://ww2.kqed.org/app/uploads/sites/10/2020/07/7599343071984525152-800x600.jpg 800w, https://ww2.kqed.org/app/uploads/sites/10/2020/07/7599343071984525152-160x120.jpg 160w, https://ww2.kqed.org/app/uploads/sites/10/2020/07/7599343071984525152-632x474.jpg 632w, https://ww2.kqed.org/app/uploads/sites/10/2020/07/7599343071984525152-536x402.jpg 536w, https://ww2.kqed.org/app/uploads/sites/10/2020/07/7599343071984525152.jpg 960w\" sizes=\"(max-width: 800px) 100vw, 800px\">\u003cfigcaption class=\"wp-caption-text\">Faith leaders hold a sunrise vigil outside San Quentin State Prison Wednesday, calling for Chanthon Bun to be released, rather than transferred to U.S. Immigration and Customs Enforcement. \u003ccite>(Courtesy of Anoop Prasad)\u003c/cite>\u003c/figcaption>\u003c/figure>\n\u003cp>Many expected Bun to be handed into the custody of U.S. Immigration and Customs Enforcement (ICE), but he was allowed to walk free. An ICE agent had visited Bun last Friday and told him he would be picked up when prison officials processed him for release, according to Prasad. Bun is a lawful permanent resident of the U.S. but because he has a felony conviction, ICE is able to place him in deportation proceedings.\u003c/p>\n\u003cp>“It’s a miracle that I got released and it’s a blessing,\" said Bun Thursday speaking by phone from a residence attached to a Bay Area church, where he is self-quarantining. \"Pandemic or not, I’d rather be released out here than to be handed over to ICE,” he said. Testing positive for COVID-19, Bun knew his situation would have gotten worse had he been transferred to ICE.\u003c/p>\n\u003cp>As a small child, Bun and his family fled Cambodia during the Khmer Rouge genocide of the 1970s, made it to a Thai refugee camp and were eventually resettled by the U.S. government in Los Angeles. Growing up in a traumatized community with no mental health care, Bun, like other young refugees, wound up abusing alcohol and joining a gang, as he described in a recent \u003ca href=\"https://www.kalw.org/post/coming-terms-his-trauma-one-man-reflects-war-torn-childhood#stream/0\">episode\u003c/a> of the KALW Radio series “Uncuffed.”\u003c/p>\n\u003cp>[ad fullwidth]\u003c/p>\n\u003cp>Prasad said it’s unclear whether someone in the state prison system or Gov. Gavin Newsom’s office intervened on Bun’s behalf.\u003c/p>\n\u003cp>“We're incredibly grateful that he is home and able to receive medical care in a safe environment,” Prasad said. “He's immunocompromised, with a rare blood disorder, and may not have survived ICE custody — and may have also possibly infected other people.”\u003c/p>\n\u003cp>While it is the policy of the California Department of Corrections and Rehabilitation (CDCR) to cooperate with ICE, it's not required by state or federal law, Prasad said.\u003c/p>\n\u003cp>Advocates have long been pressing CDCR and the governor to halt the policy, particularly in light of California’s sanctuary law. Those calls have become more urgent in recent months as the coronavirus began \u003ca href=\"https://www.kqed.org/news/11823564/as-covid-19-surges-through-prisons-guards-and-inmates-sue\">raging through both the state prison system and ICE detention centers\u003c/a>.\u003c/p>\n\u003cp>In April, the ACLU sued California officials to stop transferring immigrants to ICE during the pandemic, but on May 13, the California Supreme Court ruled 6-1 that the transfers could continue. One week earlier, the \u003ca href=\"https://www.kqed.org/news/11816707/man-dies-of-covid-19-in-san-diego-ice-detention-center-lawyers-say\">first person died in ICE custody\u003c/a>, at San Diego’s Otay Mesa Detention Center.\u003c/p>\n\u003cp>Bun’s release came the same day that \u003ca href=\"https://www.kqed.org/news/11827142/lawmakers-want-stronger-covid-19-protections-in-california-prisons\" target=\"_blank\" rel=\"noopener noreferrer\">state lawmakers questioned CDCR\u003c/a> Secretary Ralph Diaz about the policy. At a hearing of the state Senate Public Safety Committee Wednesday in Sacramento, Sen. Scott Weiner said the transfers risk spreading the virus further.\u003c/p>\n\u003cp>“When we transfer to ICE, we are sending people who may be medically vulnerable themselves to private prison ICE detention facilities,\" Weiner said. Adding that they believe that one in three detainees has COVID-19. \"These are COVID hot spots,” he said, \"we need to stop transferring people in the custody of our state prisons to ICE detention facilities ... immediately.”\u003c/p>\n\u003cp>Diaz replied that state prison officials do not transport inmates to ICE. But he said when immigration authorities place a detainer on an immigrant in prison, CDCR does inform ICE of the release date, just as officials do with any other law enforcement agency.\u003c/p>\n\u003cp>“If an individual has served their term ... and there is a hold or a warrant by ICE as a pickup, they're picked up by ICE, just like any other law enforcement agency who may have a hold on an individual to take into their custody for their reasons,” he said, adding that if there's a hold, they will continue to enforce it.\u003c/p>\n\u003cp>Newsom’s office did not return a request for comment.\u003c/p>\n\u003cp>The Oakland-based immigration law clinic \u003ca href=\"https://www.centrolegal.org\" target=\"_blank\" rel=\"noopener noreferrer\">Centro Legal de la Raza\u003c/a> found that more than a third of the 159 immigrants in ICE custody in Northern California who were assisted by legal aid groups between March 1 and May 23 had been transferred to ICE from California prisons. And Prasad said roughly 10% of all state prison inmates are subject to an ICE detainer.\u003c/p>\n\u003cp>Bun was originally sentenced to 49 years for his part in an armed robbery, in which no one was hurt, Prasad said. A 2015 law allows inmates who had committed crimes in their youth and served at least 15 years to apply for early parole. In February, after a lengthy process to prove he had turned his life around, Gov. Newsom granted Bun parole, Prasad said. [aside tag=\"coronavirus\" label=\"More Related Stories\"]\u003c/p>\n\u003cp>Hanging over Bun’s release, however, was the threat that he could be locked up in an ICE facility and eventually deported. Bun said he spent his final days at San Quentin readying himself for that possibility and the risk of catching COVID-19 in ICE detention —not realizing he was already infected.\u003c/p>\n\u003cp>“I scrounged up extra masks that I could find in there, extra cleaner and sanitizer. I had a whole care package for myself with my medications and stuff,” Bun said. “I was ready to somehow battle COVID in ICE because I knew that once I got to ICE, either I protect myself or get sick in there.”\u003c/p>\n\u003cp>He paused, then added, “I was actually contemplating writing a last letter to my family ... letting them know I’m proud of them and I got to see them grow. Leaving them with words of joy.”\u003c/p>\n\u003cp>[ad floatright]\u003c/p>\n\u003cp>Now that he’s free, he won’t have to write that letter.\u003c/p>\n\n","blocks":[],"excerpt":"The release comes as lawmakers press state prison officials to stop transferring inmates to immigration custody during pandemic.\r\n","status":"publish","parent":0,"modified":1593804295,"stats":{"hasAudio":false,"hasVideo":false,"hasChartOrMap":false,"iframeSrcs":[],"hasGoogleForm":false,"hasGallery":false,"hasHearkenModule":false,"hasPolis":false,"paragraphCount":23,"wordCount":1129},"headData":{"title":"Cambodian Refugee Leaves San Quentin With COVID-19 But Avoids ICE Detention | KQED","description":"The release comes as lawmakers press state prison officials to stop transferring inmates to immigration custody during pandemic.\r\n","ogTitle":"","ogDescription":"","ogImgId":"","twTitle":"","twDescription":"","twImgId":"","schema":{"@context":"http://schema.org","@type":"NewsArticle","headline":"Cambodian Refugee Leaves San Quentin With COVID-19 But Avoids ICE Detention","datePublished":"2020-07-03T14:00:34.000Z","dateModified":"2020-07-03T19:24:55.000Z","image":"https://cdn.kqed.org/wp-content/uploads/2020/02/KQED-OG-Image@1x.png","isAccessibleForFree":"Y","publisher":{"@type":"NewsMediaOrganization","@id":"https://www.kqed.org/#organization","name":"KQED","url":"https://www.kqed.org","logo":"https://cdn.kqed.org/wp-content/uploads/2020/02/KQED-OG-Image@1x.png"}}},"disqusIdentifier":"11827388 https://ww2.kqed.org/news/?p=11827388","disqusUrl":"https://ww2.kqed.org/news/2020/07/03/cambodian-refugee-leaves-san-quentin-with-covid-19-but-avoids-ice-detention/","disqusTitle":"Cambodian Refugee Leaves San Quentin With COVID-19 But Avoids ICE Detention","source":"News","sourceUrl":"http://kqed.org/","audioUrl":"https://traffic.omny.fm/d/clips/0af137ef-751e-4b19-a055-aaef00d2d578/ffca7e9f-6831-41c5-bcaf-aaef00f5a073/24c9dfae-b7b9-4555-9b18-abec0159c1f0/audio.mp3","path":"/news/11827388/cambodian-refugee-leaves-san-quentin-with-covid-19-but-avoids-ice-detention","audioTrackLength":null,"parsedContent":[{"type":"contentString","content":"\u003cdiv class=\"post-body\">\u003cp>\u003cp>Chanthon Bun, a Cambodian refugee, was released from San Quentin State Prison Wednesday to two unexpected discoveries: he was not turned over to immigration officials for deportation, as he had feared, but he was infected with COVID-19, along with more than 1,000 others at San Quentin.\u003c/p>\n\u003cp>Bun, 41, was greeted at the prison gates in Marin County by friends and supporters who helped secure his release. According to Bun’s lawyer, Anoop Prasad with San Francisco’s \u003ca href=\"https://www.advancingjustice-alc.org\">Asian Law Caucus\u003c/a> Bun served 23 years for an armed robbery committed when he was 18. Friends took Bun to get a coronavirus test, since the disease has \u003ca href=\"https://www.kqed.org/news/11826530/incarceration-should-not-mean-a-death-sentence-advocates-want-a-plan-to-stop-covid-19-spread-in-san-quentin\">swept through San Quentin\u003c/a> in recent weeks, and Bun tested positive. By Wednesday night, he had spiked a fever, Prasad said.\u003c/p>\n\u003cfigure id=\"attachment_11827397\" class=\"wp-caption alignnone\" style=\"max-width: 800px\">\u003cimg class=\"size-medium wp-image-11827397\" src=\"https://ww2.kqed.org/app/uploads/sites/10/2020/07/7599343071984525152-800x600.jpg\" alt=\"\" width=\"800\" height=\"600\" srcset=\"https://ww2.kqed.org/app/uploads/sites/10/2020/07/7599343071984525152-800x600.jpg 800w, https://ww2.kqed.org/app/uploads/sites/10/2020/07/7599343071984525152-160x120.jpg 160w, https://ww2.kqed.org/app/uploads/sites/10/2020/07/7599343071984525152-632x474.jpg 632w, https://ww2.kqed.org/app/uploads/sites/10/2020/07/7599343071984525152-536x402.jpg 536w, https://ww2.kqed.org/app/uploads/sites/10/2020/07/7599343071984525152.jpg 960w\" sizes=\"(max-width: 800px) 100vw, 800px\">\u003cfigcaption class=\"wp-caption-text\">Faith leaders hold a sunrise vigil outside San Quentin State Prison Wednesday, calling for Chanthon Bun to be released, rather than transferred to U.S. Immigration and Customs Enforcement. \u003ccite>(Courtesy of Anoop Prasad)\u003c/cite>\u003c/figcaption>\u003c/figure>\n\u003cp>Many expected Bun to be handed into the custody of U.S. Immigration and Customs Enforcement (ICE), but he was allowed to walk free. An ICE agent had visited Bun last Friday and told him he would be picked up when prison officials processed him for release, according to Prasad. Bun is a lawful permanent resident of the U.S. but because he has a felony conviction, ICE is able to place him in deportation proceedings.\u003c/p>\n\u003cp>“It’s a miracle that I got released and it’s a blessing,\" said Bun Thursday speaking by phone from a residence attached to a Bay Area church, where he is self-quarantining. \"Pandemic or not, I’d rather be released out here than to be handed over to ICE,” he said. Testing positive for COVID-19, Bun knew his situation would have gotten worse had he been transferred to ICE.\u003c/p>\n\u003cp>As a small child, Bun and his family fled Cambodia during the Khmer Rouge genocide of the 1970s, made it to a Thai refugee camp and were eventually resettled by the U.S. government in Los Angeles. Growing up in a traumatized community with no mental health care, Bun, like other young refugees, wound up abusing alcohol and joining a gang, as he described in a recent \u003ca href=\"https://www.kalw.org/post/coming-terms-his-trauma-one-man-reflects-war-torn-childhood#stream/0\">episode\u003c/a> of the KALW Radio series “Uncuffed.”\u003c/p>\n\u003cp>\u003c/p>\u003c/div>","attributes":{"named":{},"numeric":[]}},{"type":"component","content":"","name":"ad","attributes":{"named":{"label":"fullwidth"},"numeric":["fullwidth"]}},{"type":"contentString","content":"\u003cdiv class=\"post-body\">\u003cp>\u003c/p>\n\u003cp>Prasad said it’s unclear whether someone in the state prison system or Gov. Gavin Newsom’s office intervened on Bun’s behalf.\u003c/p>\n\u003cp>“We're incredibly grateful that he is home and able to receive medical care in a safe environment,” Prasad said. “He's immunocompromised, with a rare blood disorder, and may not have survived ICE custody — and may have also possibly infected other people.”\u003c/p>\n\u003cp>While it is the policy of the California Department of Corrections and Rehabilitation (CDCR) to cooperate with ICE, it's not required by state or federal law, Prasad said.\u003c/p>\n\u003cp>Advocates have long been pressing CDCR and the governor to halt the policy, particularly in light of California’s sanctuary law. Those calls have become more urgent in recent months as the coronavirus began \u003ca href=\"https://www.kqed.org/news/11823564/as-covid-19-surges-through-prisons-guards-and-inmates-sue\">raging through both the state prison system and ICE detention centers\u003c/a>.\u003c/p>\n\u003cp>In April, the ACLU sued California officials to stop transferring immigrants to ICE during the pandemic, but on May 13, the California Supreme Court ruled 6-1 that the transfers could continue. One week earlier, the \u003ca href=\"https://www.kqed.org/news/11816707/man-dies-of-covid-19-in-san-diego-ice-detention-center-lawyers-say\">first person died in ICE custody\u003c/a>, at San Diego’s Otay Mesa Detention Center.\u003c/p>\n\u003cp>Bun’s release came the same day that \u003ca href=\"https://www.kqed.org/news/11827142/lawmakers-want-stronger-covid-19-protections-in-california-prisons\" target=\"_blank\" rel=\"noopener noreferrer\">state lawmakers questioned CDCR\u003c/a> Secretary Ralph Diaz about the policy. At a hearing of the state Senate Public Safety Committee Wednesday in Sacramento, Sen. Scott Weiner said the transfers risk spreading the virus further.\u003c/p>\n\u003cp>“When we transfer to ICE, we are sending people who may be medically vulnerable themselves to private prison ICE detention facilities,\" Weiner said. Adding that they believe that one in three detainees has COVID-19. \"These are COVID hot spots,” he said, \"we need to stop transferring people in the custody of our state prisons to ICE detention facilities ... immediately.”\u003c/p>\n\u003cp>Diaz replied that state prison officials do not transport inmates to ICE. But he said when immigration authorities place a detainer on an immigrant in prison, CDCR does inform ICE of the release date, just as officials do with any other law enforcement agency.\u003c/p>\n\u003cp>“If an individual has served their term ... and there is a hold or a warrant by ICE as a pickup, they're picked up by ICE, just like any other law enforcement agency who may have a hold on an individual to take into their custody for their reasons,” he said, adding that if there's a hold, they will continue to enforce it.\u003c/p>\n\u003cp>Newsom’s office did not return a request for comment.\u003c/p>\n\u003cp>The Oakland-based immigration law clinic \u003ca href=\"https://www.centrolegal.org\" target=\"_blank\" rel=\"noopener noreferrer\">Centro Legal de la Raza\u003c/a> found that more than a third of the 159 immigrants in ICE custody in Northern California who were assisted by legal aid groups between March 1 and May 23 had been transferred to ICE from California prisons. And Prasad said roughly 10% of all state prison inmates are subject to an ICE detainer.\u003c/p>\n\u003cp>Bun was originally sentenced to 49 years for his part in an armed robbery, in which no one was hurt, Prasad said. A 2015 law allows inmates who had committed crimes in their youth and served at least 15 years to apply for early parole. In February, after a lengthy process to prove he had turned his life around, Gov. Newsom granted Bun parole, Prasad said. \u003c/p>\u003c/div>","attributes":{"named":{},"numeric":[]}},{"type":"component","content":"","name":"aside","attributes":{"named":{"tag":"coronavirus","label":"More Related Stories "},"numeric":[]}},{"type":"contentString","content":"\u003cdiv class=\"post-body\">\u003cp>\u003c/p>\n\u003cp>Hanging over Bun’s release, however, was the threat that he could be locked up in an ICE facility and eventually deported. Bun said he spent his final days at San Quentin readying himself for that possibility and the risk of catching COVID-19 in ICE detention —not realizing he was already infected.\u003c/p>\n\u003cp>“I scrounged up extra masks that I could find in there, extra cleaner and sanitizer. I had a whole care package for myself with my medications and stuff,” Bun said. “I was ready to somehow battle COVID in ICE because I knew that once I got to ICE, either I protect myself or get sick in there.”\u003c/p>\n\u003cp>He paused, then added, “I was actually contemplating writing a last letter to my family ... letting them know I’m proud of them and I got to see them grow. Leaving them with words of joy.”\u003c/p>\n\u003cp>\u003c/p>\u003c/div>","attributes":{"named":{},"numeric":[]}},{"type":"component","content":"","name":"ad","attributes":{"named":{"label":"floatright"},"numeric":["floatright"]}},{"type":"contentString","content":"\u003cdiv class=\"post-body\">\u003cp>\u003c/p>\n\u003cp>Now that he’s free, he won’t have to write that letter.\u003c/p>\n\n\u003c/div>\u003c/p>","attributes":{"named":{},"numeric":[]}}],"link":"/news/11827388/cambodian-refugee-leaves-san-quentin-with-covid-19-but-avoids-ice-detention","authors":["259"],"programs":["news_6944","news_72"],"categories":["news_1169","news_6188","news_8"],"tags":["news_3149","news_1629","news_27350","news_27504","news_21027","news_20202","news_23454","news_20463","news_23"],"featImg":"news_11827394","label":"source_news_11827388"},"news_11818524":{"type":"posts","id":"news_11818524","meta":{"index":"posts_1591205157","site":"news","id":"11818524","score":null,"sort":[1589513230000]},"guestAuthors":[],"slug":"governor-proposes-painful-cuts-to-health-care-programs-to-close-budget-shortfall","title":"Governor Proposes Painful Cuts to Health Care Programs to Close Budget Shortfall","publishDate":1589513230,"format":"standard","headTitle":"The California Report | KQED News","labelTerm":{},"content":"\u003cp>With so many Californians losing jobs and health insurance because of the pandemic, the state estimates 2 million more people will sign up for Medi-Cal coverage this year, bringing the total caseload in the health care program for low-income Californians to 14.5 million people.\u003c/p>\n\u003cp>To pay for the increase in enrollment, Gov. Gavin Newsom wants to cut back on some of the benefits patients will receive and the rates doctors will get paid to see them.\u003c/p>\n\u003cp>“There are areas where we clearly can’t do what we wanted to do,” Newsom said during a press conference on Thursday. “We wanted to make more progress with the January budget. Unfortunately, that progress will be delayed.” [pullquote size=\"medium\" align=\"right\" citation=\"Dr. Peter N. Bretan, president of the California Medical Association\"]\"This budget will widen the inequality gap between those on public and private insurance at a time when more Californians are struggling, and an additional 2 million low-income Californians will be dependent on Medi-Cal.\"[/pullquote]\u003c/p>\n\u003cp>Services like vision care, podiatry, hearing aids, and speech and physical therapy will no longer be covered by Medi-Cal under the governor’s \u003ca href=\"http://www.ebudget.ca.gov/FullBudgetSummary.pdf\" target=\"_blank\" rel=\"noopener noreferrer\">revised budget\u003c/a>. Dental services will also be greatly reduced.\u003c/p>\n\u003cp>Many of these benefits had just been restored – letters went out to recipients in January that some were now available again – after they were cut in the last economic downturn.\u003c/p>\n\u003cp>“We spent a lot of time trying to work our way out of the hole that we dug 10 years ago during the Great Recession,” said Anthony Wright, executive director of Health Access California, an advocacy group. “And we're looking to repeat the exact same mistakes of making these cuts that have these unintended consequences throughout the health system.”\u003c/p>\n\u003cp>The governor is also proposing to reroute $1.2 billion raised from the state’s tobacco tax. Instead of \u003ca href=\"https://www.kqed.org/stateofhealth/339838/is-the-fight-over-tobacco-tax-money-about-helping-patients-or-enriching-doctors\" target=\"_blank\" rel=\"noopener noreferrer\">increasing payments to doctors\u003c/a> and clinics that treat Medi-Cal patients, as the money was intended when it was passed by voters in 2016 as Proposition 56, the state would like to redirect it to fund the growth in general Medi-Cal costs.[ad fullwidth]\u003c/p>\n\u003cp>Doctors groups, which spent millions to help pass the tobacco tax, say this cut to reimbursement rates will create more pressure and uncertainty on physician practices at a time when many are already facing big drops in revenue because of canceled surgeries and appointments. Doctors say this could force them to limit the number of Medi-Cal patients they see.\u003c/p>\n\u003cp>“This budget will widen the inequality gap between those on public and private insurance at a time when more Californians are struggling, and an additional 2 million low-income Californians will be dependent on Medi-Cal,” said Dr. Peter N. Bretan, president of the California Medical Association. “The governor’s proposal will make it harder for those patients to get the care they need when they need it.” [aside tag=\"health, coronavirus\" label=\"More Related Coverage\"]\u003c/p>\n\u003cp>In addition to the cuts in services and reimbursement rates, the state is also scrapping various plans to expand and protect Medi-Cal coverage for seniors, in particular, for undocumented adults over age 65, which was one of the governor’s main goals in bringing the state closer to universal health coverage. Undocumented children and young adults will still be eligible.\u003c/p>\n\u003cp>Tens of thousands of older Californians who are blind and disabled and earn between $16,332 and $17,609 per year will not be able to get Medi-Cal coverage, as was originally proposed in the governor’s January draft budget. And a policy that would have prevented the state from taking Medi-Cal beneficiaries’ homes or estates as payment was rescinded, serving as a deterrent for some seniors to sign up, said Health Access’ Anthony Wright.\u003c/p>\n\u003cp>“These are cuts to senior care and coverage that are really troubling,” he said, “especially since seniors are the most at risk population in this COVID-19 crisis.”\u003c/p>\n\u003cp>\u003c/p>\n","blocks":[],"excerpt":"Doctors and health advocates are unhappy with the governor's cuts to the state Medi-Cal program.","status":"publish","parent":0,"modified":1589581773,"stats":{"hasAudio":false,"hasVideo":false,"hasChartOrMap":false,"iframeSrcs":[],"hasGoogleForm":false,"hasGallery":false,"hasHearkenModule":false,"hasPolis":false,"paragraphCount":13,"wordCount":685},"headData":{"title":"Governor Proposes Painful Cuts to Health Care Programs to Close Budget Shortfall | KQED","description":"Doctors and health advocates are unhappy with the governor's cuts to the state Medi-Cal program.","ogTitle":"","ogDescription":"","ogImgId":"","twTitle":"","twDescription":"","twImgId":"","schema":{"@context":"http://schema.org","@type":"NewsArticle","headline":"Governor Proposes Painful Cuts to Health Care Programs to Close Budget Shortfall","datePublished":"2020-05-15T03:27:10.000Z","dateModified":"2020-05-15T22:29:33.000Z","image":"https://cdn.kqed.org/wp-content/uploads/2020/02/KQED-OG-Image@1x.png","isAccessibleForFree":"Y","publisher":{"@type":"NewsMediaOrganization","@id":"https://www.kqed.org/#organization","name":"KQED","url":"https://www.kqed.org","logo":"https://cdn.kqed.org/wp-content/uploads/2020/02/KQED-OG-Image@1x.png"}}},"disqusIdentifier":"11818524 https://ww2.kqed.org/news/?p=11818524","disqusUrl":"https://ww2.kqed.org/news/2020/05/14/governor-proposes-painful-cuts-to-health-care-programs-to-close-budget-shortfall/","disqusTitle":"Governor Proposes Painful Cuts to Health Care Programs to Close Budget Shortfall","source":"Coronavirus","sourceUrl":"https://www.kqed.org/coronavirus","path":"/news/11818524/governor-proposes-painful-cuts-to-health-care-programs-to-close-budget-shortfall","audioTrackLength":null,"parsedContent":[{"type":"contentString","content":"\u003cdiv class=\"post-body\">\u003cp>\u003cp>With so many Californians losing jobs and health insurance because of the pandemic, the state estimates 2 million more people will sign up for Medi-Cal coverage this year, bringing the total caseload in the health care program for low-income Californians to 14.5 million people.\u003c/p>\n\u003cp>To pay for the increase in enrollment, Gov. Gavin Newsom wants to cut back on some of the benefits patients will receive and the rates doctors will get paid to see them.\u003c/p>\n\u003cp>“There are areas where we clearly can’t do what we wanted to do,” Newsom said during a press conference on Thursday. “We wanted to make more progress with the January budget. Unfortunately, that progress will be delayed.” \u003c/p>\u003c/div>","attributes":{"named":{},"numeric":[]}},{"type":"component","content":"\"This budget will widen the inequality gap between those on public and private insurance at a time when more Californians are struggling, and an additional 2 million low-income Californians will be dependent on Medi-Cal.\"","name":"pullquote","attributes":{"named":{"size":"medium","align":"right","citation":"Dr. Peter N. Bretan, president of the California Medical Association","label":""},"numeric":[]}},{"type":"contentString","content":"\u003cdiv class=\"post-body\">\u003cp>\u003c/p>\n\u003cp>Services like vision care, podiatry, hearing aids, and speech and physical therapy will no longer be covered by Medi-Cal under the governor’s \u003ca href=\"http://www.ebudget.ca.gov/FullBudgetSummary.pdf\" target=\"_blank\" rel=\"noopener noreferrer\">revised budget\u003c/a>. Dental services will also be greatly reduced.\u003c/p>\n\u003cp>Many of these benefits had just been restored – letters went out to recipients in January that some were now available again – after they were cut in the last economic downturn.\u003c/p>\n\u003cp>“We spent a lot of time trying to work our way out of the hole that we dug 10 years ago during the Great Recession,” said Anthony Wright, executive director of Health Access California, an advocacy group. “And we're looking to repeat the exact same mistakes of making these cuts that have these unintended consequences throughout the health system.”\u003c/p>\n\u003cp>The governor is also proposing to reroute $1.2 billion raised from the state’s tobacco tax. Instead of \u003ca href=\"https://www.kqed.org/stateofhealth/339838/is-the-fight-over-tobacco-tax-money-about-helping-patients-or-enriching-doctors\" target=\"_blank\" rel=\"noopener noreferrer\">increasing payments to doctors\u003c/a> and clinics that treat Medi-Cal patients, as the money was intended when it was passed by voters in 2016 as Proposition 56, the state would like to redirect it to fund the growth in general Medi-Cal costs.\u003c/p>\u003c/div>","attributes":{"named":{},"numeric":[]}},{"type":"component","content":"","name":"ad","attributes":{"named":{"label":"fullwidth"},"numeric":["fullwidth"]}},{"type":"contentString","content":"\u003cdiv class=\"post-body\">\u003cp>\u003c/p>\n\u003cp>Doctors groups, which spent millions to help pass the tobacco tax, say this cut to reimbursement rates will create more pressure and uncertainty on physician practices at a time when many are already facing big drops in revenue because of canceled surgeries and appointments. Doctors say this could force them to limit the number of Medi-Cal patients they see.\u003c/p>\n\u003cp>“This budget will widen the inequality gap between those on public and private insurance at a time when more Californians are struggling, and an additional 2 million low-income Californians will be dependent on Medi-Cal,” said Dr. Peter N. Bretan, president of the California Medical Association. “The governor’s proposal will make it harder for those patients to get the care they need when they need it.” \u003c/p>\u003c/div>","attributes":{"named":{},"numeric":[]}},{"type":"component","content":"","name":"aside","attributes":{"named":{"tag":"health, coronavirus","label":"More Related Coverage "},"numeric":[]}},{"type":"contentString","content":"\u003cdiv class=\"post-body\">\u003cp>\u003c/p>\n\u003cp>In addition to the cuts in services and reimbursement rates, the state is also scrapping various plans to expand and protect Medi-Cal coverage for seniors, in particular, for undocumented adults over age 65, which was one of the governor’s main goals in bringing the state closer to universal health coverage. Undocumented children and young adults will still be eligible.\u003c/p>\n\u003cp>Tens of thousands of older Californians who are blind and disabled and earn between $16,332 and $17,609 per year will not be able to get Medi-Cal coverage, as was originally proposed in the governor’s January draft budget. And a policy that would have prevented the state from taking Medi-Cal beneficiaries’ homes or estates as payment was rescinded, serving as a deterrent for some seniors to sign up, said Health Access’ Anthony Wright.\u003c/p>\n\u003cp>“These are cuts to senior care and coverage that are really troubling,” he said, “especially since seniors are the most at risk population in this COVID-19 crisis.”\u003c/p>\n\u003cp>\u003c/p>\n\u003c/div>\u003c/p>","attributes":{"named":{},"numeric":[]}}],"link":"/news/11818524/governor-proposes-painful-cuts-to-health-care-programs-to-close-budget-shortfall","authors":["3205"],"programs":["news_6944","news_72"],"categories":["news_1758","news_457","news_8","news_13"],"tags":["news_1759","news_18538","news_27350","news_16","news_683","news_2605"],"featImg":"news_11818533","label":"source_news_11818524"},"news_11805573":{"type":"posts","id":"news_11805573","meta":{"index":"posts_1591205157","site":"news","id":"11805573","score":null,"sort":[1583524377000]},"guestAuthors":[],"slug":"sf-officials-slam-ice-for-arresting-man-outside-courthouse","title":"SF Officials Slam ICE for Arresting Man Outside Courthouse","publishDate":1583524377,"format":"standard","headTitle":"The California Report | KQED News","labelTerm":{"term":72,"site":"news"},"content":"\u003cp>An undocumented man was detained by federal immigration authorities this week in front of the San Francisco Hall of Justice, where the criminal courts are located. The arrest was strongly condemned by the city’s public defender and district attorney, who say courthouses should be off limits to immigration enforcement.\u003c/p>\n\u003cp>The San Francisco resident was on his way to a court hearing at 850 Bryant St. when he was arrested by U.S. Immigration and Customs Enforcement agents — the first such arrest in the city, said the Public Defender’s Office.\u003c/p>\n\u003cp>“This undermines community trust and public safety,” said San Francisco Public Defender Mano Raju. “It does deter people from coming to court.”\u003c/p>\n\u003cp>Last month, ICE agents also \u003ca href=\"https://www.sfchronicle.com/crime/article/ICE-arrests-3-at-Sonoma-County-courthouse-local-15067595.php\">detained two men\u003c/a> at the Sonoma County Superior Court. [aside tag=\"immigration\" label=\"related coverage\"]\u003c/p>\n\u003cp>The courthouse arrests come as the Trump administration has renewed efforts to counter sanctuary jurisdictions, arguing they interfere with federal immigration enforcement.\u003c/p>\n\u003cp>This week, President Trump said the federal government will begin \u003ca href=\"https://thehill.com/homenews/administration/486078-trump-government-will-start-withholding-funds-from-sanctuary-cities\">withholding grants\u003c/a> from sanctuary cities and states, after an appeals court in Manhattan ruled they have the authority to do so. U.S. Attorney General William Barr \u003ca href=\"https://www.justice.gov/opa/speech/attorney-general-william-p-barr-delivers-remarks-national-sheriffs-association-winter\">said\u003c/a> last month that public areas of courthouses must be accessible to federal law enforcement officers.\u003c/p>\n\u003cp>A California law that took effect this year, \u003ca href=\"https://leginfo.legislature.ca.gov/faces/billTextClient.xhtml?bill_id=201920200AB668\">Assembly Bill 668\u003c/a>, which prohibits civil arrests in courthouses without a judicial warrant, which the agents did not have.\u003c/p>\n\u003cp>“California law explicitly forbids a civil enforcement agency like ICE from making a civil arrest without warrant outside of a courthouse,” Raju said.\u003c/p>\n\u003cp>But the Trump administration argues that immigration agents have the authority to make courthouse arrests without judicial warrants. While ICE generally avoids immigration enforcement at “\u003ca href=\"https://www.ice.gov/ero/enforcement/sensitive-loc\">sensitive locations\u003c/a>” such as schools, churches and hospitals, it does not treat courthouses that way.\u003c/p>\n\u003cp>The undocumented Mexican national who was detained in San Francisco on Tuesday had three felony convictions for second-degree burglary from 2016, 2017 and 2019, according to ICE. The agency identified him as 43-year-old Alberto Uc Ponce.\u003c/p>\n\u003cp>The agency said it arrested him near the courthouse because local law enforcement had refused to turn him over to ICE several times. The agency said local jurisdictions that don’t cooperate with ICE are likely to see an increase of arrests in the community, as agents are less able to detain immigrants at jails.\u003c/p>\n\u003cp>David Jennings, field office director for ICE in San Francisco, blamed sanctuary policies.\u003c/p>\n\u003cp>“Criminals like this individual are released to reoffend again and again,” said Jennings in a statement. “A simple phone call to ICE to arrange the secure transfer of such individuals would serve the hard-working residents of the city far more than a misguided sanctuary policy that, as proven here and numerous times in the past, goes to great lengths to protect criminals under the guise of protecting the citizenry.” [ad fullwidth]\u003c/p>\n\u003cp>California’s sanctuary law, \u003ca href=\"https://leginfo.legislature.ca.gov/faces/billNavClient.xhtml?bill_id=201720180SB54\">Senate Bill 54\u003c/a>, prohibits local police, sheriffs and jail officials from handing over immigrants to ICE, unless they have been convicted of serious felonies or other crimes, including burglary.\u003c/p>\n\u003cp>The man’s attorney at the Public Defender’s Office, Emilou MacLean, declined to comment on her client’s criminal history, or whether he was protected by SB 54.\u003c/p>\n\u003cp>“This is a question of the illegitimacy and the illegality of courthouse arrests — where ICE is essentially stationing itself at the courthouse and ambushing someone who shows up for a court hearing,” said MacLean in an email. [pullquote size='medium' align='right' citation='Attorney Emilou MacLean']'This is a question of the illegitimacy and the illegality of courthouse arrests — where ICE is essentially stationing itself at the courthouse and ambushing someone who shows up for a court hearing'[/pullquote]\u003c/p>\n\u003cp>San Francisco District Attorney Chesa Boudin also called for ICE to stop making arrests at courthouses.\u003c/p>\n\u003cp>“ICE actions in or near our courthouses deters people from accessing our justice system, making us all less safe,” Boudin said.\u003c/p>\n\u003cp>But Jennings, the ICE field office director, said federal immigration agents are not bound by California's law against courthouse arrests.\u003c/p>\n\u003cp>“California Assembly Bill 668 cannot and will not govern the conduct of federal officers acting pursuant to duly-enacted laws passed by Congress that provide the authority to make administrative arrests of removable aliens inside the United States,” he said.\u003c/p>\n\u003cp>Assemblywoman Lorena Gonzalez, D-San Diego, who authored AB 668, said President Trump’s “aggressive immigration policies are making all of our communities less safe.”\u003c/p>\n\u003cp>“When people don’t feel safe showing up to court to act as a witness, pay a fine or file papers — the system is broken,” she said.\u003c/p>\n\u003cp>\u003c/p>\n","blocks":[],"excerpt":"The San Francisco resident was on his way to a court hearing at 850 Bryant St. when he was arrested by Immigration and Customs Enforcement agents, the first such arrest in the city, said the public defender’s office.","status":"publish","parent":0,"modified":1583540809,"stats":{"hasAudio":false,"hasVideo":false,"hasChartOrMap":false,"iframeSrcs":[],"hasGoogleForm":false,"hasGallery":false,"hasHearkenModule":false,"hasPolis":false,"paragraphCount":23,"wordCount":803},"headData":{"title":"SF Officials Slam ICE for Arresting Man Outside Courthouse | KQED","description":"The San Francisco resident was on his way to a court hearing at 850 Bryant St. when he was arrested by Immigration and Customs Enforcement agents, the first such arrest in the city, said the public defender’s office.","ogTitle":"","ogDescription":"","ogImgId":"","twTitle":"","twDescription":"","twImgId":"","schema":{"@context":"http://schema.org","@type":"NewsArticle","headline":"SF Officials Slam ICE for Arresting Man Outside Courthouse","datePublished":"2020-03-06T19:52:57.000Z","dateModified":"2020-03-07T00:26:49.000Z","image":"https://cdn.kqed.org/wp-content/uploads/2020/02/KQED-OG-Image@1x.png","isAccessibleForFree":"Y","publisher":{"@type":"NewsMediaOrganization","@id":"https://www.kqed.org/#organization","name":"KQED","url":"https://www.kqed.org","logo":"https://cdn.kqed.org/wp-content/uploads/2020/02/KQED-OG-Image@1x.png"}}},"disqusIdentifier":"11805573 https://ww2.kqed.org/news/?p=11805573","disqusUrl":"https://ww2.kqed.org/news/2020/03/06/sf-officials-slam-ice-for-arresting-man-outside-courthouse/","disqusTitle":"SF Officials Slam ICE for Arresting Man Outside Courthouse","path":"/news/11805573/sf-officials-slam-ice-for-arresting-man-outside-courthouse","audioTrackLength":null,"parsedContent":[{"type":"contentString","content":"\u003cdiv class=\"post-body\">\u003cp>\u003cp>An undocumented man was detained by federal immigration authorities this week in front of the San Francisco Hall of Justice, where the criminal courts are located. The arrest was strongly condemned by the city’s public defender and district attorney, who say courthouses should be off limits to immigration enforcement.\u003c/p>\n\u003cp>The San Francisco resident was on his way to a court hearing at 850 Bryant St. when he was arrested by U.S. Immigration and Customs Enforcement agents — the first such arrest in the city, said the Public Defender’s Office.\u003c/p>\n\u003cp>“This undermines community trust and public safety,” said San Francisco Public Defender Mano Raju. “It does deter people from coming to court.”\u003c/p>\n\u003cp>Last month, ICE agents also \u003ca href=\"https://www.sfchronicle.com/crime/article/ICE-arrests-3-at-Sonoma-County-courthouse-local-15067595.php\">detained two men\u003c/a> at the Sonoma County Superior Court. \u003c/p>\u003c/div>","attributes":{"named":{},"numeric":[]}},{"type":"component","content":"","name":"aside","attributes":{"named":{"tag":"immigration","label":"related coverage "},"numeric":[]}},{"type":"contentString","content":"\u003cdiv class=\"post-body\">\u003cp>\u003c/p>\n\u003cp>The courthouse arrests come as the Trump administration has renewed efforts to counter sanctuary jurisdictions, arguing they interfere with federal immigration enforcement.\u003c/p>\n\u003cp>This week, President Trump said the federal government will begin \u003ca href=\"https://thehill.com/homenews/administration/486078-trump-government-will-start-withholding-funds-from-sanctuary-cities\">withholding grants\u003c/a> from sanctuary cities and states, after an appeals court in Manhattan ruled they have the authority to do so. U.S. Attorney General William Barr \u003ca href=\"https://www.justice.gov/opa/speech/attorney-general-william-p-barr-delivers-remarks-national-sheriffs-association-winter\">said\u003c/a> last month that public areas of courthouses must be accessible to federal law enforcement officers.\u003c/p>\n\u003cp>A California law that took effect this year, \u003ca href=\"https://leginfo.legislature.ca.gov/faces/billTextClient.xhtml?bill_id=201920200AB668\">Assembly Bill 668\u003c/a>, which prohibits civil arrests in courthouses without a judicial warrant, which the agents did not have.\u003c/p>\n\u003cp>“California law explicitly forbids a civil enforcement agency like ICE from making a civil arrest without warrant outside of a courthouse,” Raju said.\u003c/p>\n\u003cp>But the Trump administration argues that immigration agents have the authority to make courthouse arrests without judicial warrants. While ICE generally avoids immigration enforcement at “\u003ca href=\"https://www.ice.gov/ero/enforcement/sensitive-loc\">sensitive locations\u003c/a>” such as schools, churches and hospitals, it does not treat courthouses that way.\u003c/p>\n\u003cp>The undocumented Mexican national who was detained in San Francisco on Tuesday had three felony convictions for second-degree burglary from 2016, 2017 and 2019, according to ICE. The agency identified him as 43-year-old Alberto Uc Ponce.\u003c/p>\n\u003cp>The agency said it arrested him near the courthouse because local law enforcement had refused to turn him over to ICE several times. The agency said local jurisdictions that don’t cooperate with ICE are likely to see an increase of arrests in the community, as agents are less able to detain immigrants at jails.\u003c/p>\n\u003cp>David Jennings, field office director for ICE in San Francisco, blamed sanctuary policies.\u003c/p>\n\u003cp>“Criminals like this individual are released to reoffend again and again,” said Jennings in a statement. “A simple phone call to ICE to arrange the secure transfer of such individuals would serve the hard-working residents of the city far more than a misguided sanctuary policy that, as proven here and numerous times in the past, goes to great lengths to protect criminals under the guise of protecting the citizenry.” \u003c/p>\u003c/div>","attributes":{"named":{},"numeric":[]}},{"type":"component","content":"","name":"ad","attributes":{"named":{"label":"fullwidth"},"numeric":["fullwidth"]}},{"type":"contentString","content":"\u003cdiv class=\"post-body\">\u003cp>\u003c/p>\n\u003cp>California’s sanctuary law, \u003ca href=\"https://leginfo.legislature.ca.gov/faces/billNavClient.xhtml?bill_id=201720180SB54\">Senate Bill 54\u003c/a>, prohibits local police, sheriffs and jail officials from handing over immigrants to ICE, unless they have been convicted of serious felonies or other crimes, including burglary.\u003c/p>\n\u003cp>The man’s attorney at the Public Defender’s Office, Emilou MacLean, declined to comment on her client’s criminal history, or whether he was protected by SB 54.\u003c/p>\n\u003cp>“This is a question of the illegitimacy and the illegality of courthouse arrests — where ICE is essentially stationing itself at the courthouse and ambushing someone who shows up for a court hearing,” said MacLean in an email. \u003c/p>\u003c/div>","attributes":{"named":{},"numeric":[]}},{"type":"component","content":"'This is a question of the illegitimacy and the illegality of courthouse arrests — where ICE is essentially stationing itself at the courthouse and ambushing someone who shows up for a court hearing'","name":"pullquote","attributes":{"named":{"size":"medium","align":"right","citation":"Attorney Emilou MacLean","label":""},"numeric":[]}},{"type":"contentString","content":"\u003cdiv class=\"post-body\">\u003cp>\u003c/p>\n\u003cp>San Francisco District Attorney Chesa Boudin also called for ICE to stop making arrests at courthouses.\u003c/p>\n\u003cp>“ICE actions in or near our courthouses deters people from accessing our justice system, making us all less safe,” Boudin said.\u003c/p>\n\u003cp>But Jennings, the ICE field office director, said federal immigration agents are not bound by California's law against courthouse arrests.\u003c/p>\n\u003cp>“California Assembly Bill 668 cannot and will not govern the conduct of federal officers acting pursuant to duly-enacted laws passed by Congress that provide the authority to make administrative arrests of removable aliens inside the United States,” he said.\u003c/p>\n\u003cp>Assemblywoman Lorena Gonzalez, D-San Diego, who authored AB 668, said President Trump’s “aggressive immigration policies are making all of our communities less safe.”\u003c/p>\n\u003cp>“When people don’t feel safe showing up to court to act as a witness, pay a fine or file papers — the system is broken,” she said.\u003c/p>\n\u003cp>\u003c/p>\n\u003c/div>\u003c/p>","attributes":{"named":{},"numeric":[]}}],"link":"/news/11805573/sf-officials-slam-ice-for-arresting-man-outside-courthouse","authors":["8659"],"programs":["news_6944","news_72"],"categories":["news_1169","news_6188","news_8"],"tags":["news_24162","news_21027","news_20202","news_38","news_959","news_18775"],"featImg":"news_11805615","label":"news_72"},"news_11780213":{"type":"posts","id":"news_11780213","meta":{"index":"posts_1591205157","site":"news","id":"11780213","score":null,"sort":[1571245274000]},"guestAuthors":[],"slug":"new-survey-muslim-students-in-california-more-likely-to-be-bullied","title":"New Survey: Muslim Students in California More Likely to Be Bullied","publishDate":1571245274,"format":"standard","headTitle":"The California Report | KQED News","labelTerm":{"term":72,"site":"news"},"content":"\u003cp>Muslim kids in California schools continue to report being bullied or harassed at a higher rate than other students in the state and the country, according to a new report by the Council on American-Islamic Relations.\u003c/p>\n\u003cp>The \u003ca href=\"https://ca.cair.com/sfba/wp-content/uploads/sites/10/2019/09/Anti-Bully-Report_2019.pdf\" target=\"_blank\" rel=\"noopener\">survey\u003c/a>, released Wednesday, found 40% of respondents, ages 11 to 18, experienced bullying at school for being Muslim. That figure included 16% who said they were abused or harassed at least once a week, once a month or \"sometimes.\"\u003c/p>\n\u003cp>[aside postID=\"news_11778501\" label=\"Related Coverage\"]\u003c/p>\n\u003cp>The mistreatment included students being called terrorists, made fun of because they wore a hijab, and reduced to tears from teasing, the report said.\u003c/p>\n\u003cp>\"Sometimes people might say, 'Hey, going to bomb the school now?' \" said a student quoted in the study, which gathered anonymous responses from 1,500 kids in public and private schools.\u003c/p>\n\u003cp>A similar survey by the organization in 2017 found more than half of Muslim students reported being made fun of, insulted or abused, which authors linked to \"Islamophobic rhetoric\" in the 2016 presidential campaign.\u003c/p>\n\u003cp>\"I am cautiously optimistic that there is a drop in these reported numbers of bullying,\" said Ammad Wajahat Rafiqi, an attorney with CAIR in San Francisco, who contributed to the latest report. \"But we are also concerned that the numbers continue to be very high.\"\u003c/p>\n\u003cp>School administrators and teachers are becoming more aware of the problem, Rafiqi said. But the California Department of Education should do more to uphold students' right to be educated in a safe environment by mandating and funding anti-bullying training at schools, he added.\u003c/p>\n\u003cp>\"If stricter legislation as well as more proactive and mandatory trainings aren't implemented, we might continue to see these numbers in the years moving forward,\" he said.\u003c/p>\n\u003cp>[ad fullwidth]\u003c/p>\n\u003cp>Only 72% of Muslim students reported feeling comfortable telling others they are Muslim, down from 77% in the 2017 report.\u003c/p>\n\u003cp>Children who are harassed and mistreated at school have a higher risk for anxiety and depression, said Nadia Ansary, an associate professor at Rider University in New Jersey who studies discrimination and bullying of Muslim youth.\u003c/p>\n\u003cp>A state law authored by Assemblyman David Chiu, D-San Francisco, requires school districts to adopt procedures by the end of the year to prevent bullying, including cyberbullying.\u003c/p>\n\u003cp>To comply with that law, Assembly Bill 2291, the California Department of Education posted online an \u003ca href=\"https://www.cde.ca.gov/ls/ss/se/bullyres.asp\" target=\"_blank\" rel=\"noopener\">anti-bullying training module\u003c/a> that schools must offer to teachers and other employees who have regular interaction with students.\u003c/p>\n\u003cp>“In the era of Trump and abhorrent attacks on our immigrant communities, the fact that 40% of Muslim students have faced bullying is extremely troubling, but not surprising,\" Chiu said in a statement. \"Moving forward, we will be monitoring this issue and working with advocates to see what steps can be taken to make sure all students feel safe and welcome at school.”\u003c/p>\n\u003cp>Nationwide, 20% of students ages 12 to 18 report being bullied at school for a variety of reasons such as race, appearance, sexual orientation and religion, \u003ca href=\"https://nces.ed.gov/pubs2019/2019054.pdf\" target=\"_blank\" rel=\"noopener\">according to\u003c/a> 2017 data published by the U.S. Department of Education.\u003c/p>\n\u003cp>\u003ca href=\"https://data.calschls.org/resources/Biennial_State_1517.pdf\" rel=\"noopener\" target=\"_blank\">Figures from the California Department of Education\u003c/a> show about one in three students in middle and high school report being bullied for any reason. The data was collected from 2015 to 2017, the most recent available.\u003c/p>\n\u003cp>CAIR's survey covered the Greater Los Angeles, San Diego, Sacramento Valley, Central California and San Francisco Bay Area regions.\u003c/p>\n\u003cp>\u003c/p>\n","blocks":[],"excerpt":"The survey by the Council on American-Islamic Relations found 40% of respondents, ages 11 to 18, experienced bullying at school for being Muslim.","status":"publish","parent":0,"modified":1571257662,"stats":{"hasAudio":false,"hasVideo":false,"hasChartOrMap":false,"iframeSrcs":[],"hasGoogleForm":false,"hasGallery":false,"hasHearkenModule":false,"hasPolis":false,"paragraphCount":19,"wordCount":574},"headData":{"title":"New Survey: Muslim Students in California More Likely to Be Bullied | KQED","description":"The survey by the Council on American-Islamic Relations found 40% of respondents, ages 11 to 18, experienced bullying at school for being Muslim.","ogTitle":"","ogDescription":"","ogImgId":"","twTitle":"","twDescription":"","twImgId":"","schema":{"@context":"http://schema.org","@type":"NewsArticle","headline":"New Survey: Muslim Students in California More Likely to Be Bullied","datePublished":"2019-10-16T17:01:14.000Z","dateModified":"2019-10-16T20:27:42.000Z","image":"https://cdn.kqed.org/wp-content/uploads/2020/02/KQED-OG-Image@1x.png","isAccessibleForFree":"Y","publisher":{"@type":"NewsMediaOrganization","@id":"https://www.kqed.org/#organization","name":"KQED","url":"https://www.kqed.org","logo":"https://cdn.kqed.org/wp-content/uploads/2020/02/KQED-OG-Image@1x.png"}}},"disqusIdentifier":"11780213 https://ww2.kqed.org/news/?p=11780213","disqusUrl":"https://ww2.kqed.org/news/2019/10/16/new-survey-muslim-students-in-california-more-likely-to-be-bullied/","disqusTitle":"New Survey: Muslim Students in California More Likely to Be Bullied","path":"/news/11780213/new-survey-muslim-students-in-california-more-likely-to-be-bullied","audioTrackLength":null,"parsedContent":[{"type":"contentString","content":"\u003cdiv class=\"post-body\">\u003cp>\u003cp>Muslim kids in California schools continue to report being bullied or harassed at a higher rate than other students in the state and the country, according to a new report by the Council on American-Islamic Relations.\u003c/p>\n\u003cp>The \u003ca href=\"https://ca.cair.com/sfba/wp-content/uploads/sites/10/2019/09/Anti-Bully-Report_2019.pdf\" target=\"_blank\" rel=\"noopener\">survey\u003c/a>, released Wednesday, found 40% of respondents, ages 11 to 18, experienced bullying at school for being Muslim. That figure included 16% who said they were abused or harassed at least once a week, once a month or \"sometimes.\"\u003c/p>\n\u003cp>\u003c/p>\u003c/div>","attributes":{"named":{},"numeric":[]}},{"type":"component","content":"","name":"aside","attributes":{"named":{"postid":"news_11778501","label":"Related Coverage "},"numeric":[]}},{"type":"contentString","content":"\u003cdiv class=\"post-body\">\u003cp>\u003c/p>\n\u003cp>The mistreatment included students being called terrorists, made fun of because they wore a hijab, and reduced to tears from teasing, the report said.\u003c/p>\n\u003cp>\"Sometimes people might say, 'Hey, going to bomb the school now?' \" said a student quoted in the study, which gathered anonymous responses from 1,500 kids in public and private schools.\u003c/p>\n\u003cp>A similar survey by the organization in 2017 found more than half of Muslim students reported being made fun of, insulted or abused, which authors linked to \"Islamophobic rhetoric\" in the 2016 presidential campaign.\u003c/p>\n\u003cp>\"I am cautiously optimistic that there is a drop in these reported numbers of bullying,\" said Ammad Wajahat Rafiqi, an attorney with CAIR in San Francisco, who contributed to the latest report. \"But we are also concerned that the numbers continue to be very high.\"\u003c/p>\n\u003cp>School administrators and teachers are becoming more aware of the problem, Rafiqi said. But the California Department of Education should do more to uphold students' right to be educated in a safe environment by mandating and funding anti-bullying training at schools, he added.\u003c/p>\n\u003cp>\"If stricter legislation as well as more proactive and mandatory trainings aren't implemented, we might continue to see these numbers in the years moving forward,\" he said.\u003c/p>\n\u003cp>\u003c/p>\u003c/div>","attributes":{"named":{},"numeric":[]}},{"type":"component","content":"","name":"ad","attributes":{"named":{"label":"fullwidth"},"numeric":["fullwidth"]}},{"type":"contentString","content":"\u003cdiv class=\"post-body\">\u003cp>\u003c/p>\n\u003cp>Only 72% of Muslim students reported feeling comfortable telling others they are Muslim, down from 77% in the 2017 report.\u003c/p>\n\u003cp>Children who are harassed and mistreated at school have a higher risk for anxiety and depression, said Nadia Ansary, an associate professor at Rider University in New Jersey who studies discrimination and bullying of Muslim youth.\u003c/p>\n\u003cp>A state law authored by Assemblyman David Chiu, D-San Francisco, requires school districts to adopt procedures by the end of the year to prevent bullying, including cyberbullying.\u003c/p>\n\u003cp>To comply with that law, Assembly Bill 2291, the California Department of Education posted online an \u003ca href=\"https://www.cde.ca.gov/ls/ss/se/bullyres.asp\" target=\"_blank\" rel=\"noopener\">anti-bullying training module\u003c/a> that schools must offer to teachers and other employees who have regular interaction with students.\u003c/p>\n\u003cp>“In the era of Trump and abhorrent attacks on our immigrant communities, the fact that 40% of Muslim students have faced bullying is extremely troubling, but not surprising,\" Chiu said in a statement. \"Moving forward, we will be monitoring this issue and working with advocates to see what steps can be taken to make sure all students feel safe and welcome at school.”\u003c/p>\n\u003cp>Nationwide, 20% of students ages 12 to 18 report being bullied at school for a variety of reasons such as race, appearance, sexual orientation and religion, \u003ca href=\"https://nces.ed.gov/pubs2019/2019054.pdf\" target=\"_blank\" rel=\"noopener\">according to\u003c/a> 2017 data published by the U.S. Department of Education.\u003c/p>\n\u003cp>\u003ca href=\"https://data.calschls.org/resources/Biennial_State_1517.pdf\" rel=\"noopener\" target=\"_blank\">Figures from the California Department of Education\u003c/a> show about one in three students in middle and high school report being bullied for any reason. The data was collected from 2015 to 2017, the most recent available.\u003c/p>\n\u003cp>CAIR's survey covered the Greater Los Angeles, San Diego, Sacramento Valley, Central California and San Francisco Bay Area regions.\u003c/p>\n\u003cp>\u003c/p>\n\u003c/div>\u003c/p>","attributes":{"named":{},"numeric":[]}}],"link":"/news/11780213/new-survey-muslim-students-in-california-more-likely-to-be-bullied","authors":["8659"],"programs":["news_6944","news_72"],"categories":["news_8"],"tags":["news_23067","news_26790","news_20601","news_2998"],"featImg":"news_11780349","label":"news_72"}},"programsReducer":{"possible":{"id":"possible","title":"Possible","info":"Possible is hosted by entrepreneur Reid Hoffman and writer Aria Finger. Together in Possible, Hoffman and Finger lead enlightening discussions about building a brighter collective future. The show features interviews with visionary guests like Trevor Noah, Sam Altman and Janette Sadik-Khan. Possible paints an optimistic portrait of the world we can create through science, policy, business, art and our shared humanity. It asks: What if everything goes right for once? How can we get there? Each episode also includes a short fiction story generated by advanced AI GPT-4, serving as a thought-provoking springboard to speculate how humanity could leverage technology for good.","airtime":"SUN 2pm","imageSrc":"https://cdn.kqed.org/wp-content/uploads/2024/04/Possible-Podcast-Tile-360x360-1.jpg","officialWebsiteLink":"https://www.possible.fm/","meta":{"site":"news","source":"Possible"},"link":"/radio/program/possible","subscribe":{"apple":"https://podcasts.apple.com/us/podcast/possible/id1677184070","spotify":"https://open.spotify.com/show/730YpdUSNlMyPQwNnyjp4k"}},"1a":{"id":"1a","title":"1A","info":"1A is home to the national conversation. 1A brings on great guests and frames the best debate in ways that make you think, share and engage.","airtime":"MON-THU 11pm-12am","imageSrc":"https://ww2.kqed.org/radio/wp-content/uploads/sites/50/2018/04/1a.jpg","officialWebsiteLink":"https://the1a.org/","meta":{"site":"news","source":"npr"},"link":"/radio/program/1a","subscribe":{"npr":"https://rpb3r.app.goo.gl/RBrW","apple":"https://itunes.apple.com/WebObjects/MZStore.woa/wa/viewPodcast?s=143441&mt=2&id=1188724250&at=11l79Y&ct=nprdirectory","tuneIn":"https://tunein.com/radio/1A-p947376/","rss":"https://feeds.npr.org/510316/podcast.xml"}},"all-things-considered":{"id":"all-things-considered","title":"All Things Considered","info":"Every weekday, \u003cem>All Things Considered\u003c/em> hosts Robert Siegel, Audie Cornish, Ari Shapiro, and Kelly McEvers present the program's trademark mix of news, interviews, commentaries, reviews, and offbeat features. Michel Martin hosts on the weekends.","airtime":"MON-FRI 1pm-2pm, 4:30pm-6:30pm\u003cbr />SAT-SUN 5pm-6pm","imageSrc":"https://cdn.kqed.org/wp-content/uploads/2024/04/All-Things-Considered-Podcast-Tile-360x360-1.jpg","officialWebsiteLink":"https://www.npr.org/programs/all-things-considered/","meta":{"site":"news","source":"npr"},"link":"/radio/program/all-things-considered"},"american-suburb-podcast":{"id":"american-suburb-podcast","title":"American Suburb: The Podcast","tagline":"The flip side of gentrification, told through one town","info":"Gentrification is changing cities across America, forcing people from neighborhoods they have long called home. Call them the displaced. Now those priced out of the Bay Area are looking for a better life in an unlikely place. American Suburb follows this migration to one California town along the Delta, 45 miles from San Francisco. But is this once sleepy suburb ready for them?","imageSrc":"https://cdn.kqed.org/wp-content/uploads/2024/04/American-Suburb-Podcast-Tile-703x703-1.jpg","officialWebsiteLink":"/news/series/american-suburb-podcast","meta":{"site":"news","source":"kqed","order":"13"},"link":"/news/series/american-suburb-podcast/","subscribe":{"npr":"https://rpb3r.app.goo.gl/RBrW","apple":"https://itunes.apple.com/WebObjects/MZStore.woa/wa/viewPodcast?mt=2&id=1287748328","tuneIn":"https://tunein.com/radio/American-Suburb-p1086805/","rss":"https://ww2.kqed.org/news/series/american-suburb-podcast/feed/podcast","google":"https://podcasts.google.com/feed/aHR0cHM6Ly9mZWVkcy5tZWdhcGhvbmUuZm0vS1FJTkMzMDExODgxNjA5"}},"baycurious":{"id":"baycurious","title":"Bay Curious","tagline":"Exploring the Bay Area, one question at a time","info":"KQED’s new podcast, Bay Curious, gets to the bottom of the mysteries — both profound and peculiar — that give the Bay Area its unique identity. And we’ll do it with your help! You ask the questions. You decide what Bay Curious investigates. And you join us on the journey to find the answers.","imageSrc":"https://cdn.kqed.org/wp-content/uploads/2024/04/Bay-Curious-Podcast-Tile-703x703-1.jpg","imageAlt":"\"KQED Bay Curious","officialWebsiteLink":"/news/series/baycurious","meta":{"site":"news","source":"kqed","order":"4"},"link":"/podcasts/baycurious","subscribe":{"apple":"https://podcasts.apple.com/us/podcast/bay-curious/id1172473406","npr":"https://www.npr.org/podcasts/500557090/bay-curious","rss":"https://ww2.kqed.org/news/category/bay-curious-podcast/feed/podcast","google":"https://podcasts.google.com/feed/aHR0cHM6Ly93dzIua3FlZC5vcmcvbmV3cy9jYXRlZ29yeS9iYXktY3VyaW91cy1wb2RjYXN0L2ZlZWQvcG9kY2FzdA","stitcher":"https://www.stitcher.com/podcast/kqed/bay-curious","spotify":"https://open.spotify.com/show/6O76IdmhixfijmhTZLIJ8k"}},"bbc-world-service":{"id":"bbc-world-service","title":"BBC World Service","info":"The day's top stories from BBC News compiled twice daily in the week, once at weekends.","airtime":"MON-FRI 9pm-10pm, TUE-FRI 1am-2am","imageSrc":"https://cdn.kqed.org/wp-content/uploads/2024/04/BBC-World-Service-Podcast-Tile-360x360-1.jpg","officialWebsiteLink":"https://www.bbc.co.uk/sounds/play/live:bbc_world_service","meta":{"site":"news","source":"BBC World Service"},"link":"/radio/program/bbc-world-service","subscribe":{"apple":"https://itunes.apple.com/us/podcast/global-news-podcast/id135067274?mt=2","tuneIn":"https://tunein.com/radio/BBC-World-Service-p455581/","rss":"https://podcasts.files.bbci.co.uk/p02nq0gn.rss"}},"code-switch-life-kit":{"id":"code-switch-life-kit","title":"Code Switch / Life Kit","info":"\u003cem>Code Switch\u003c/em>, which listeners will hear in the first part of the hour, has fearless and much-needed conversations about race. Hosted by journalists of color, the show tackles the subject of race head-on, exploring how it impacts every part of society — from politics and pop culture to history, sports and more.\u003cbr />\u003cbr />\u003cem>Life Kit\u003c/em>, which will be in the second part of the hour, guides you through spaces and feelings no one prepares you for — from finances to mental health, from workplace microaggressions to imposter syndrome, from relationships to parenting. The show features experts with real world experience and shares their knowledge. Because everyone needs a little help being human.\u003cbr />\u003cbr />\u003ca href=\"https://www.npr.org/podcasts/510312/codeswitch\">\u003cem>Code Switch\u003c/em> offical site and podcast\u003c/a>\u003cbr />\u003ca href=\"https://www.npr.org/lifekit\">\u003cem>Life Kit\u003c/em> offical site and podcast\u003c/a>\u003cbr />","airtime":"SUN 9pm-10pm","imageSrc":"https://cdn.kqed.org/wp-content/uploads/2024/04/Code-Switch-Life-Kit-Podcast-Tile-360x360-1.jpg","meta":{"site":"radio","source":"npr"},"link":"/radio/program/code-switch-life-kit","subscribe":{"apple":"https://podcasts.apple.com/podcast/1112190608?mt=2&at=11l79Y&ct=nprdirectory","google":"https://podcasts.google.com/feed/aHR0cHM6Ly93d3cubnByLm9yZy9yc3MvcG9kY2FzdC5waHA_aWQ9NTEwMzEy","spotify":"https://open.spotify.com/show/3bExJ9JQpkwNhoHvaIIuyV","rss":"https://feeds.npr.org/510312/podcast.xml"}},"commonwealth-club":{"id":"commonwealth-club","title":"Commonwealth Club of California Podcast","info":"The Commonwealth Club of California is the nation's oldest and largest public affairs forum. As a non-partisan forum, The Club brings to the public airwaves diverse viewpoints on important topics. The Club's weekly radio broadcast - the oldest in the U.S., dating back to 1924 - is carried across the nation on public radio stations and is now podcasting. Our website archive features audio of our recent programs, as well as selected speeches from our long and distinguished history. This podcast feed is usually updated twice a week and is always un-edited.","airtime":"THU 10pm, FRI 1am","imageSrc":"https://cdn.kqed.org/wp-content/uploads/2024/04/Commonwealth-Club-Podcast-Tile-360x360-1.jpg","officialWebsiteLink":"https://www.commonwealthclub.org/podcasts","meta":{"site":"news","source":"Commonwealth Club of California"},"link":"/radio/program/commonwealth-club","subscribe":{"apple":"https://itunes.apple.com/us/podcast/commonwealth-club-of-california-podcast/id976334034?mt=2","google":"https://podcasts.google.com/feed/aHR0cDovL3d3dy5jb21tb253ZWFsdGhjbHViLm9yZy9hdWRpby9wb2RjYXN0L3dlZWtseS54bWw","tuneIn":"https://tunein.com/radio/Commonwealth-Club-of-California-p1060/"}},"considerthis":{"id":"considerthis","title":"Consider This","tagline":"Make sense of the day","info":"Make sense of the day. Every weekday afternoon, Consider This helps you consider the major stories of the day in less than 15 minutes, featuring the reporting and storytelling resources of NPR. Plus, KQED’s Bianca Taylor brings you the local KQED news you need to know.","imageSrc":"https://cdn.kqed.org/wp-content/uploads/2024/04/Consider-This-Podcast-Tile-703x703-1.jpg","imageAlt":"Consider This from NPR and KQED","officialWebsiteLink":"/podcasts/considerthis","meta":{"site":"news","source":"kqed","order":"7"},"link":"/podcasts/considerthis","subscribe":{"apple":"https://podcasts.apple.com/podcast/id1503226625?mt=2&at=11l79Y&ct=nprdirectory","npr":"https://rpb3r.app.goo.gl/coronavirusdaily","google":"https://podcasts.google.com/feed/aHR0cHM6Ly9mZWVkcy5ucHIub3JnLzUxMDM1NS9wb2RjYXN0LnhtbA","spotify":"https://open.spotify.com/show/3Z6JdCS2d0eFEpXHKI6WqH"}},"forum":{"id":"forum","title":"Forum","tagline":"The conversation starts here","info":"KQED’s live call-in program discussing local, state, national and international issues, as well as in-depth interviews.","airtime":"MON-FRI 9am-11am, 10pm-11pm","imageSrc":"https://cdn.kqed.org/wp-content/uploads/2024/04/Forum-Podcast-Tile-703x703-1.jpg","imageAlt":"KQED Forum with Mina Kim and Alexis Madrigal","officialWebsiteLink":"/forum","meta":{"site":"news","source":"kqed","order":"8"},"link":"/forum","subscribe":{"apple":"https://podcasts.apple.com/us/podcast/kqeds-forum/id73329719","google":"https://podcasts.google.com/feed/aHR0cHM6Ly9mZWVkcy5tZWdhcGhvbmUuZm0vS1FJTkM5NTU3MzgxNjMz","npr":"https://www.npr.org/podcasts/432307980/forum","stitcher":"https://www.stitcher.com/podcast/kqedfm-kqeds-forum-podcast","rss":"https://feeds.megaphone.fm/KQINC9557381633"}},"freakonomics-radio":{"id":"freakonomics-radio","title":"Freakonomics Radio","info":"Freakonomics Radio is a one-hour award-winning podcast and public-radio project hosted by Stephen Dubner, with co-author Steve Levitt as a regular guest. It is produced in partnership with WNYC.","imageSrc":"https://ww2.kqed.org/news/wp-content/uploads/sites/10/2018/05/freakonomicsRadio.png","officialWebsiteLink":"http://freakonomics.com/","airtime":"SUN 1am-2am, SAT 3pm-4pm","meta":{"site":"radio","source":"WNYC"},"link":"/radio/program/freakonomics-radio","subscribe":{"npr":"https://rpb3r.app.goo.gl/4s8b","apple":"https://itunes.apple.com/us/podcast/freakonomics-radio/id354668519","tuneIn":"https://tunein.com/podcasts/WNYC-Podcasts/Freakonomics-Radio-p272293/","rss":"https://feeds.feedburner.com/freakonomicsradio"}},"fresh-air":{"id":"fresh-air","title":"Fresh Air","info":"Hosted by Terry Gross, \u003cem>Fresh Air from WHYY\u003c/em> is the Peabody Award-winning weekday magazine of contemporary arts and issues. One of public radio's most popular programs, Fresh Air features intimate conversations with today's biggest luminaries.","airtime":"MON-FRI 7pm-8pm","imageSrc":"https://cdn.kqed.org/wp-content/uploads/2024/04/Fresh-Air-Podcast-Tile-360x360-1.jpg","officialWebsiteLink":"https://www.npr.org/programs/fresh-air/","meta":{"site":"radio","source":"npr"},"link":"/radio/program/fresh-air","subscribe":{"npr":"https://rpb3r.app.goo.gl/4s8b","apple":"https://itunes.apple.com/WebObjects/MZStore.woa/wa/viewPodcast?s=143441&mt=2&id=214089682&at=11l79Y&ct=nprdirectory","tuneIn":"https://tunein.com/radio/Fresh-Air-p17/","rss":"https://feeds.npr.org/381444908/podcast.xml"}},"here-and-now":{"id":"here-and-now","title":"Here & Now","info":"A live production of NPR and WBUR Boston, in collaboration with stations across the country, Here & Now reflects the fluid world of news as it's happening in the middle of the day, with timely, in-depth news, interviews and conversation. Hosted by Robin Young, Jeremy Hobson and Tonya Mosley.","airtime":"MON-THU 11am-12pm","imageSrc":"https://cdn.kqed.org/wp-content/uploads/2024/04/Here-And-Now-Podcast-Tile-360x360-1.jpg","officialWebsiteLink":"http://www.wbur.org/hereandnow","meta":{"site":"news","source":"npr"},"link":"/radio/program/here-and-now","subsdcribe":{"apple":"https://itunes.apple.com/WebObjects/MZStore.woa/wa/viewPodcast?mt=2&id=426698661","tuneIn":"https://tunein.com/radio/Here--Now-p211/","rss":"https://feeds.npr.org/510051/podcast.xml"}},"how-i-built-this":{"id":"how-i-built-this","title":"How I Built This with Guy Raz","info":"Guy Raz dives into the stories behind some of the world's best known companies. How I Built This weaves a narrative journey about innovators, entrepreneurs and idealists—and the movements they built.","imageSrc":"https://ww2.kqed.org/news/wp-content/uploads/sites/10/2018/05/howIBuiltThis.png","officialWebsiteLink":"https://www.npr.org/podcasts/510313/how-i-built-this","airtime":"SUN 7:30pm-8pm","meta":{"site":"news","source":"npr"},"link":"/radio/program/how-i-built-this","subscribe":{"npr":"https://rpb3r.app.goo.gl/3zxy","apple":"https://itunes.apple.com/us/podcast/how-i-built-this-with-guy-raz/id1150510297?mt=2","tuneIn":"https://tunein.com/podcasts/Arts--Culture-Podcasts/How-I-Built-This-p910896/","rss":"https://feeds.npr.org/510313/podcast.xml"}},"inside-europe":{"id":"inside-europe","title":"Inside Europe","info":"Inside Europe, a one-hour weekly news magazine hosted by Helen Seeney and Keith Walker, explores the topical issues shaping the continent. No other part of the globe has experienced such dynamic political and social change in recent years.","airtime":"SAT 3am-4am","imageSrc":"https://cdn.kqed.org/wp-content/uploads/2024/04/Inside-Europe-Podcast-Tile-300x300-1.jpg","meta":{"site":"news","source":"Deutsche Welle"},"link":"/radio/program/inside-europe","subscribe":{"apple":"https://itunes.apple.com/us/podcast/inside-europe/id80106806?mt=2","tuneIn":"https://tunein.com/radio/Inside-Europe-p731/","rss":"https://partner.dw.com/xml/podcast_inside-europe"}},"latino-usa":{"id":"latino-usa","title":"Latino USA","airtime":"MON 1am-2am, SUN 6pm-7pm","info":"Latino USA, the radio journal of news and culture, is the only national, English-language radio program produced from a Latino perspective.","imageSrc":"https://ww2.kqed.org/radio/wp-content/uploads/sites/50/2018/04/latinoUsa.jpg","officialWebsiteLink":"http://latinousa.org/","meta":{"site":"news","source":"npr"},"link":"/radio/program/latino-usa","subscribe":{"npr":"https://rpb3r.app.goo.gl/xtTd","apple":"https://itunes.apple.com/WebObjects/MZStore.woa/wa/viewPodcast?s=143441&mt=2&id=79681317&at=11l79Y&ct=nprdirectory","tuneIn":"https://tunein.com/radio/Latino-USA-p621/","rss":"https://feeds.npr.org/510016/podcast.xml"}},"live-from-here-highlights":{"id":"live-from-here-highlights","title":"Live from Here Highlights","info":"Chris Thile steps to the mic as the host of Live from Here (formerly A Prairie Home Companion), a live public radio variety show. Download Chris’s Song of the Week plus other highlights from the broadcast. Produced by American Public Media.","airtime":"SAT 6pm-8pm, SUN 11am-1pm","imageSrc":"https://cdn.kqed.org/wp-content/uploads/2024/04/Live-From-Here-Podcast-Tile-360x360-1.jpg","officialWebsiteLink":"https://www.livefromhere.org/","meta":{"site":"arts","source":"american public media"},"link":"/radio/program/live-from-here-highlights","subscribe":{"apple":"https://itunes.apple.com/us/podcast/id1167173941","tuneIn":"https://tunein.com/radio/Live-from-Here-Highlights-p921744/","rss":"https://feeds.publicradio.org/public_feeds/a-prairie-home-companion-highlights/rss/rss"}},"marketplace":{"id":"marketplace","title":"Marketplace","info":"Our flagship program, helmed by Kai Ryssdal, examines what the day in money delivered, through stories, conversations, newsworthy numbers and more. Updated Monday through Friday at about 3:30 p.m. PT.","airtime":"MON-FRI 4pm-4:30pm, MON-WED 6:30pm-7pm","imageSrc":"https://cdn.kqed.org/wp-content/uploads/2024/04/Marketplace-Podcast-Tile-360x360-1.jpg","officialWebsiteLink":"https://www.marketplace.org/","meta":{"site":"news","source":"American Public Media"},"link":"/radio/program/marketplace","subscribe":{"apple":"https://itunes.apple.com/WebObjects/MZStore.woa/wa/viewPodcast?s=143441&mt=2&id=201853034&at=11l79Y&ct=nprdirectory","tuneIn":"https://tunein.com/radio/APM-Marketplace-p88/","rss":"https://feeds.publicradio.org/public_feeds/marketplace-pm/rss/rss"}},"mindshift":{"id":"mindshift","title":"MindShift","tagline":"A podcast about the future of learning and how we raise our kids","info":"The MindShift podcast explores the innovations in education that are shaping how kids learn. Hosts Ki Sung and Katrina Schwartz introduce listeners to educators, researchers, parents and students who are developing effective ways to improve how kids learn. We cover topics like how fed-up administrators are developing surprising tactics to deal with classroom disruptions; how listening to podcasts are helping kids develop reading skills; the consequences of overparenting; and why interdisciplinary learning can engage students on all ends of the traditional achievement spectrum. This podcast is part of the MindShift education site, a division of KQED News. KQED is an NPR/PBS member station based in San Francisco. You can also visit the MindShift website for episodes and supplemental blog posts or tweet us \u003ca href=\"https://twitter.com/MindShiftKQED\">@MindShiftKQED\u003c/a> or visit us at \u003ca href=\"/mindshift\">MindShift.KQED.org\u003c/a>","imageSrc":"https://cdn.kqed.org/wp-content/uploads/2024/04/Mindshift-Podcast-Tile-703x703-1.jpg","imageAlt":"KQED MindShift: How We Will Learn","officialWebsiteLink":"/mindshift/","meta":{"site":"news","source":"kqed","order":"2"},"link":"/podcasts/mindshift","subscribe":{"apple":"https://podcasts.apple.com/us/podcast/mindshift-podcast/id1078765985","google":"https://podcasts.google.com/feed/aHR0cHM6Ly9mZWVkcy5tZWdhcGhvbmUuZm0vS1FJTkM1NzY0NjAwNDI5","npr":"https://www.npr.org/podcasts/464615685/mind-shift-podcast","stitcher":"https://www.stitcher.com/podcast/kqed/stories-teachers-share","spotify":"https://open.spotify.com/show/0MxSpNYZKNprFLCl7eEtyx"}},"morning-edition":{"id":"morning-edition","title":"Morning Edition","info":"\u003cem>Morning Edition\u003c/em> takes listeners around the country and the world with multi-faceted stories and commentaries every weekday. Hosts Steve Inskeep, David Greene and Rachel Martin bring you the latest breaking news and features to prepare you for the day.","airtime":"MON-FRI 3am-9am","imageSrc":"https://cdn.kqed.org/wp-content/uploads/2024/04/Morning-Edition-Podcast-Tile-360x360-1.jpg","officialWebsiteLink":"https://www.npr.org/programs/morning-edition/","meta":{"site":"news","source":"npr"},"link":"/radio/program/morning-edition"},"onourwatch":{"id":"onourwatch","title":"On Our Watch","tagline":"Police secrets, unsealed","info":"For decades, the process for how police police themselves has been inconsistent – if not opaque. In some states, like California, these proceedings were completely hidden. After a new police transparency law unsealed scores of internal affairs files, our reporters set out to examine these cases and the shadow world of police discipline. On Our Watch brings listeners into the rooms where officers are questioned and witnesses are interrogated to find out who this system is really protecting. Is it the officers, or the public they've sworn to serve?","imageSrc":"https://cdn.kqed.org/wp-content/uploads/2024/04/On-Our-Watch-Podcast-Tile-703x703-1.jpg","imageAlt":"On Our Watch from NPR and KQED","officialWebsiteLink":"/podcasts/onourwatch","meta":{"site":"news","source":"kqed","order":"1"},"link":"/podcasts/onourwatch","subscribe":{"apple":"https://podcasts.apple.com/podcast/id1567098962","google":"https://podcasts.google.com/feed/aHR0cHM6Ly9mZWVkcy5ucHIub3JnLzUxMDM2MC9wb2RjYXN0LnhtbD9zYz1nb29nbGVwb2RjYXN0cw","npr":"https://rpb3r.app.goo.gl/onourwatch","spotify":"https://open.spotify.com/show/0OLWoyizopu6tY1XiuX70x","tuneIn":"https://tunein.com/radio/On-Our-Watch-p1436229/","stitcher":"https://www.stitcher.com/show/on-our-watch","rss":"https://feeds.npr.org/510360/podcast.xml"}},"on-the-media":{"id":"on-the-media","title":"On The Media","info":"Our weekly podcast explores how the media 'sausage' is made, casts an incisive eye on fluctuations in the marketplace of ideas, and examines threats to the freedom of information and expression in America and abroad. For one hour a week, the show tries to lift the veil from the process of \"making media,\" especially news media, because it's through that lens that we see the world and the world sees us","airtime":"SUN 2pm-3pm, MON 12am-1am","imageSrc":"https://ww2.kqed.org/radio/wp-content/uploads/sites/50/2018/04/onTheMedia.png","officialWebsiteLink":"https://www.wnycstudios.org/shows/otm","meta":{"site":"news","source":"wnyc"},"link":"/radio/program/on-the-media","subscribe":{"apple":"https://itunes.apple.com/us/podcast/on-the-media/id73330715?mt=2","tuneIn":"https://tunein.com/radio/On-the-Media-p69/","rss":"http://feeds.wnyc.org/onthemedia"}},"our-body-politic":{"id":"our-body-politic","title":"Our Body Politic","info":"Presented by KQED, KCRW and KPCC, and created and hosted by award-winning journalist Farai Chideya, Our Body Politic is unapologetically centered on reporting on not just how women of color experience the major political events of today, but how they’re impacting those very issues.","airtime":"SAT 6pm-7pm, SUN 1am-2am","imageSrc":"https://cdn.kqed.org/wp-content/uploads/2024/04/Our-Body-Politic-Podcast-Tile-360x360-1.jpg","officialWebsiteLink":"https://our-body-politic.simplecast.com/","meta":{"site":"news","source":"kcrw"},"link":"/radio/program/our-body-politic","subscribe":{"apple":"https://podcasts.apple.com/us/podcast/our-body-politic/id1533069868","google":"https://podcasts.google.com/feed/aHR0cHM6Ly9mZWVkcy5zaW1wbGVjYXN0LmNvbS9feGFQaHMxcw","spotify":"https://open.spotify.com/show/4ApAiLT1kV153TttWAmqmc","rss":"https://feeds.simplecast.com/_xaPhs1s","tuneIn":"https://tunein.com/podcasts/News--Politics-Podcasts/Our-Body-Politic-p1369211/"}},"pbs-newshour":{"id":"pbs-newshour","title":"PBS NewsHour","info":"Analysis, background reports and updates from the PBS NewsHour putting today's news in context.","airtime":"MON-FRI 3pm-4pm","imageSrc":"https://cdn.kqed.org/wp-content/uploads/2024/04/PBS-News-Hour-Podcast-Tile-360x360-1.jpg","officialWebsiteLink":"https://www.pbs.org/newshour/","meta":{"site":"news","source":"pbs"},"link":"/radio/program/pbs-newshour","subscribe":{"apple":"https://itunes.apple.com/us/podcast/pbs-newshour-full-show/id394432287?mt=2","tuneIn":"https://tunein.com/radio/PBS-NewsHour---Full-Show-p425698/","rss":"https://www.pbs.org/newshour/feeds/rss/podcasts/show"}},"perspectives":{"id":"perspectives","title":"Perspectives","tagline":"KQED's series of of daily listener commentaries since 1991","info":"KQED's series of of daily listener commentaries since 1991.","imageSrc":"https://cdn.kqed.org/wp-content/uploads/2024/04/Perspectives-Podcast-Tile-703x703-1.jpg","officialWebsiteLink":"/perspectives/","meta":{"site":"radio","source":"kqed","order":"15"},"link":"/perspectives","subscribe":{"apple":"https://podcasts.apple.com/us/podcast/id73801135","npr":"https://www.npr.org/podcasts/432309616/perspectives","rss":"https://ww2.kqed.org/perspectives/category/perspectives/feed/","google":"https://podcasts.google.com/feed/aHR0cHM6Ly93dzIua3FlZC5vcmcvcGVyc3BlY3RpdmVzL2NhdGVnb3J5L3BlcnNwZWN0aXZlcy9mZWVkLw"}},"planet-money":{"id":"planet-money","title":"Planet Money","info":"The economy explained. Imagine you could call up a friend and say, Meet me at the bar and tell me what's going on with the economy. Now imagine that's actually a fun evening.","airtime":"SUN 3pm-4pm","imageSrc":"https://ww2.kqed.org/radio/wp-content/uploads/sites/50/2018/04/planetmoney.jpg","officialWebsiteLink":"https://www.npr.org/sections/money/","meta":{"site":"news","source":"npr"},"link":"/radio/program/planet-money","subscribe":{"npr":"https://rpb3r.app.goo.gl/M4f5","apple":"https://itunes.apple.com/us/podcast/planet-money/id290783428?mt=2","tuneIn":"https://tunein.com/podcasts/Business--Economics-Podcasts/Planet-Money-p164680/","rss":"https://feeds.npr.org/510289/podcast.xml"}},"politicalbreakdown":{"id":"politicalbreakdown","title":"Political Breakdown","tagline":"Politics from a personal perspective","info":"Political Breakdown is a new series that explores the political intersection of California and the nation. Each week hosts Scott Shafer and Marisa Lagos are joined with a new special guest to unpack politics -- with personality — and offer an insider’s glimpse at how politics happens.","airtime":"THU 6:30pm-7pm","imageSrc":"https://cdn.kqed.org/wp-content/uploads/2024/04/Political-Breakdown-2024-Podcast-Tile-703x703-1.jpg","imageAlt":"KQED Political Breakdown","officialWebsiteLink":"/podcasts/politicalbreakdown","meta":{"site":"radio","source":"kqed","order":"11"},"link":"/podcasts/politicalbreakdown","subscribe":{"apple":"https://podcasts.apple.com/us/podcast/political-breakdown/id1327641087","google":"https://podcasts.google.com/feed/aHR0cHM6Ly9mZWVkcy5tZWdhcGhvbmUuZm0vS1FJTkM5Nzk2MzI2MTEx","npr":"https://www.npr.org/podcasts/572155894/political-breakdown","stitcher":"https://www.stitcher.com/podcast/kqed/political-breakdown","spotify":"https://open.spotify.com/show/07RVyIjIdk2WDuVehvBMoN","rss":"https://ww2.kqed.org/news/tag/political-breakdown/feed/podcast"}},"pri-the-world":{"id":"pri-the-world","title":"PRI's The World: Latest Edition","info":"Each weekday, host Marco Werman and his team of producers bring you the world's most interesting stories in an hour of radio that reminds us just how small our planet really is.","airtime":"MON-FRI 2pm-3pm","imageSrc":"https://cdn.kqed.org/wp-content/uploads/2024/04/The-World-Podcast-Tile-360x360-1.jpg","officialWebsiteLink":"https://www.pri.org/programs/the-world","meta":{"site":"news","source":"PRI"},"link":"/radio/program/pri-the-world","subscribe":{"apple":"https://itunes.apple.com/us/podcast/pris-the-world-latest-edition/id278196007?mt=2","tuneIn":"https://tunein.com/podcasts/News--Politics-Podcasts/PRIs-The-World-p24/","rss":"http://feeds.feedburner.com/pri/theworld"}},"radiolab":{"id":"radiolab","title":"Radiolab","info":"A two-time Peabody Award-winner, Radiolab is an investigation told through sounds and stories, and centered around one big idea. In the Radiolab world, information sounds like music and science and culture collide. Hosted by Jad Abumrad and Robert Krulwich, the show is designed for listeners who demand skepticism, but appreciate wonder. WNYC Studios is the producer of other leading podcasts including Freakonomics Radio, Death, Sex & Money, On the Media and many more.","airtime":"SUN 12am-1am, SAT 2pm-3pm","imageSrc":"https://ww2.kqed.org/radio/wp-content/uploads/sites/50/2018/04/radiolab1400.png","officialWebsiteLink":"https://www.wnycstudios.org/shows/radiolab/","meta":{"site":"science","source":"WNYC"},"link":"/radio/program/radiolab","subscribe":{"apple":"https://itunes.apple.com/us/podcast/radiolab/id152249110?mt=2","tuneIn":"https://tunein.com/radio/RadioLab-p68032/","rss":"https://feeds.wnyc.org/radiolab"}},"reveal":{"id":"reveal","title":"Reveal","info":"Created by The Center for Investigative Reporting and PRX, Reveal is public radios first one-hour weekly radio show and podcast dedicated to investigative reporting. Credible, fact based and without a partisan agenda, Reveal combines the power and artistry of driveway moment storytelling with data-rich reporting on critically important issues. The result is stories that inform and inspire, arming our listeners with information to right injustices, hold the powerful accountable and improve lives.Reveal is hosted by Al Letson and showcases the award-winning work of CIR and newsrooms large and small across the nation. In a radio and podcast market crowded with choices, Reveal focuses on important and often surprising stories that illuminate the world for our listeners.","airtime":"SAT 4pm-5pm","imageSrc":"https://ww2.kqed.org/radio/wp-content/uploads/sites/50/2018/04/reveal300px.png","officialWebsiteLink":"https://www.revealnews.org/episodes/","meta":{"site":"news","source":"npr"},"link":"/radio/program/reveal","subscribe":{"apple":"https://itunes.apple.com/us/podcast/reveal/id886009669","tuneIn":"https://tunein.com/radio/Reveal-p679597/","rss":"http://feeds.revealradio.org/revealpodcast"}},"says-you":{"id":"says-you","title":"Says You!","info":"Public radio's game show of bluff and bluster, words and whimsy. The warmest, wittiest cocktail party - it's spirited and civil, brainy and boisterous, peppered with musical interludes. Fast paced and playful, it's the most fun you can have with language without getting your mouth washed out with soap. Our motto: It's not important to know the answers, it's important to like the answers!","airtime":"SUN 4pm-5pm","imageSrc":"https://cdn.kqed.org/wp-content/uploads/2024/04/Says-You-Podcast-Tile-360x360-1.jpg","officialWebsiteLink":"http://www.saysyouradio.com/","meta":{"site":"comedy","source":"Pipit and Finch"},"link":"/radio/program/says-you","subscribe":{"apple":"https://itunes.apple.com/us/podcast/says-you!/id1050199826","tuneIn":"https://tunein.com/radio/Says-You-p480/","rss":"https://saysyou.libsyn.com/rss"}},"science-friday":{"id":"science-friday","title":"Science Friday","info":"Science Friday is a weekly science talk show, broadcast live over public radio stations nationwide. Each week, the show focuses on science topics that are in the news and tries to bring an educated, balanced discussion to bear on the scientific issues at hand. Panels of expert guests join host Ira Flatow, a veteran science journalist, to discuss science and to take questions from listeners during the call-in portion of the program.","airtime":"FRI 11am-1pm","imageSrc":"https://cdn.kqed.org/wp-content/uploads/2024/04/Science-Friday-Podcast-Tile-360x360-1.jpg","officialWebsiteLink":"https://www.wnycstudios.org/shows/science-friday","meta":{"site":"news","source":"npr"},"link":"/radio/program/science-friday","subscribe":{"apple":"https://itunes.apple.com/WebObjects/MZStore.woa/wa/viewPodcast?s=143441&mt=2&id=73329284&at=11l79Y&ct=nprdirectory","tuneIn":"https://tunein.com/radio/Science-Friday-p394/","rss":"http://feeds.wnyc.org/science-friday"}},"science-podcast":{"id":"science-podcast","title":"KQED Science News","tagline":"From the lab, to your ears","info":"KQED Science explores science and environment news, trends, and events from the Bay Area and beyond.","imageSrc":"https://cdn.kqed.org/wp-content/uploads/2024/04/Science-News-Podcast-Tile-703x703-1.jpg","officialWebsiteLink":"https://ww2.kqed.org/science/category/science-podcast/","meta":{"site":"science","source":"kqed","order":"17"},"link":"/science/category/science-podcast","subscribe":{"apple":"https://podcasts.apple.com/us/podcast/kqed-science-news/id214663465","google":"https://podcasts.google.com/feed/aHR0cDovL2Jsb2dzLmtxZWQub3JnL3NjaWVuY2UvZmVlZC8","stitcher":"https://www.stitcher.com/podcast/kqed-science-news","rss":"https://ww2.kqed.org/science/category/science-podcast/feed/podcast"}},"selected-shorts":{"id":"selected-shorts","title":"Selected Shorts","info":"Spellbinding short stories by established and emerging writers take on a new life when they are performed by stars of the stage and screen.","airtime":"SAT 8pm-9pm","imageSrc":"https://cdn.kqed.org/wp-content/uploads/2024/04/Selected-Shorts-Podcast-Tile-360x360-1.jpg","officialWebsiteLink":"https://www.pri.org/programs/selected-shorts","meta":{"site":"arts","source":"pri"},"link":"/radio/program/selected-shorts","subscribe":{"apple":"https://itunes.apple.com/WebObjects/MZStore.woa/wa/viewPodcast?s=143441&mt=2&id=253191824&at=11l79Y&ct=nprdirectory","tuneIn":"https://tunein.com/radio/Selected-Shorts-p31792/","rss":"https://feeds.megaphone.fm/selectedshorts"}},"snap-judgment":{"id":"snap-judgment","title":"Snap Judgment","info":"Snap Judgment (Storytelling, with a BEAT) mixes real stories with killer beats to produce cinematic, dramatic, kick-ass radio. Snap’s raw, musical brand of storytelling dares listeners to see the world through the eyes of another. WNYC studios is the producer of leading podcasts including Radiolab, Freakonomics Radio, Note To Self, Here’s The Thing With Alec Baldwin, and more.","airtime":"SAT 1pm-2pm, 9pm-10pm","imageSrc":"https://ww2.kqed.org/radio/wp-content/uploads/sites/50/2018/04/snapJudgement.jpg","officialWebsiteLink":"https://snapjudgment.org","meta":{"site":"arts","source":"WNYC"},"link":"/radio/program/snap-judgment","subscribe":{"apple":"https://itunes.apple.com/WebObjects/MZStore.woa/wa/viewPodcast?s=143441&mt=2&id=283657561&at=11l79Y&ct=nprdirectory","tuneIn":"https://tunein.com/radio/Snap-Judgment-p243817/","rss":"https://feeds.feedburner.com/snapjudgment-wnyc"}},"soldout":{"id":"soldout","title":"SOLD OUT: Rethinking Housing in America","tagline":"A new future for housing","info":"Sold Out: Rethinking Housing in America","imageSrc":"https://cdn.kqed.org/wp-content/uploads/2024/04/Sold-Out-Podcast-Tile-703x703-1.jpg","imageAlt":"KQED Sold Out: Rethinking Housing in America","officialWebsiteLink":"/podcasts/soldout","meta":{"site":"news","source":"kqed","order":3},"link":"/podcasts/soldout","subscribe":{"npr":"https://www.npr.org/podcasts/911586047/s-o-l-d-o-u-t-a-new-future-for-housing","apple":"https://podcasts.apple.com/us/podcast/introducing-sold-out-rethinking-housing-in-america/id1531354937","rss":"https://feeds.megaphone.fm/soldout","spotify":"https://open.spotify.com/show/38dTBSk2ISFoPiyYNoKn1X","stitcher":"https://www.stitcher.com/podcast/kqed/sold-out-rethinking-housing-in-america","tunein":"https://tunein.com/radio/SOLD-OUT-Rethinking-Housing-in-America-p1365871/","google":"https://podcasts.google.com/feed/aHR0cHM6Ly9mZWVkcy5tZWdhcGhvbmUuZm0vc29sZG91dA"}},"ted-radio-hour":{"id":"ted-radio-hour","title":"TED Radio Hour","info":"The TED Radio Hour is a journey through fascinating ideas, astonishing inventions, fresh approaches to old problems, and new ways to think and create.","airtime":"SUN 3pm-4pm, SAT 10pm-11pm","imageSrc":"https://ww2.kqed.org/radio/wp-content/uploads/sites/50/2018/04/tedRadioHour.jpg","officialWebsiteLink":"https://www.npr.org/programs/ted-radio-hour/?showDate=2018-06-22","meta":{"site":"news","source":"npr"},"link":"/radio/program/ted-radio-hour","subscribe":{"npr":"https://rpb3r.app.goo.gl/8vsS","apple":"https://itunes.apple.com/WebObjects/MZStore.woa/wa/viewPodcast?s=143441&mt=2&id=523121474&at=11l79Y&ct=nprdirectory","tuneIn":"https://tunein.com/radio/TED-Radio-Hour-p418021/","rss":"https://feeds.npr.org/510298/podcast.xml"}},"tech-nation":{"id":"tech-nation","title":"Tech Nation Radio Podcast","info":"Tech Nation is a weekly public radio program, hosted by Dr. Moira Gunn. Founded in 1993, it has grown from a simple interview show to a multi-faceted production, featuring conversations with noted technology and science leaders, and a weekly science and technology-related commentary.","airtime":"FRI 10pm","imageSrc":"https://cdn.kqed.org/wp-content/uploads/2024/04/Tech-Nation-Radio-Podcast-Tile-360x360-1.jpg","officialWebsiteLink":"http://technation.podomatic.com/","meta":{"site":"science","source":"Tech Nation Media"},"link":"/radio/program/tech-nation","subscribe":{"rss":"https://technation.podomatic.com/rss2.xml"}},"thebay":{"id":"thebay","title":"The Bay","tagline":"Local news to keep you rooted","info":"Host Devin Katayama walks you through the biggest story of the day with reporters and newsmakers.","imageSrc":"https://cdn.kqed.org/wp-content/uploads/2024/04/The-Bay-Podcast-Tile-703x703-1.jpg","imageAlt":"\"KQED The Bay","officialWebsiteLink":"/podcasts/thebay","meta":{"site":"radio","source":"kqed","order":"6"},"link":"/podcasts/thebay","subscribe":{"apple":"https://podcasts.apple.com/us/podcast/the-bay/id1350043452","google":"https://podcasts.google.com/feed/aHR0cHM6Ly9mZWVkcy5tZWdhcGhvbmUuZm0vS1FJTkM4MjU5Nzg2MzI3","npr":"https://www.npr.org/podcasts/586725995/the-bay","stitcher":"https://www.stitcher.com/podcast/kqed/the-bay","spotify":"https://open.spotify.com/show/4BIKBKIujizLHlIlBNaAqQ","rss":"https://feeds.megaphone.fm/KQINC8259786327"}},"californiareport":{"id":"californiareport","title":"The California Report","tagline":"California, day by day","info":"KQED’s statewide radio news program providing daily coverage of issues, trends and public policy decisions.","imageSrc":"https://cdn.kqed.org/wp-content/uploads/2024/04/The-California-Report-Podcast-Tile-703x703-1.jpg","imageAlt":"KQED The California Report","officialWebsiteLink":"/californiareport","meta":{"site":"news","source":"kqed","order":"9"},"link":"/californiareport","subscribe":{"apple":"https://podcasts.apple.com/us/podcast/kqeds-the-california-report/id79681292","google":"https://podcasts.google.com/feed/aHR0cHM6Ly9mZWVkcy5tZWdhcGhvbmUuZm0vS1FJTkM1MDAyODE4NTgz","npr":"https://www.npr.org/podcasts/432285393/the-california-report","stitcher":"https://www.stitcher.com/podcast/kqedfm-kqeds-the-california-report-podcast-8838","rss":"https://ww2.kqed.org/news/tag/tcram/feed/podcast"}},"californiareportmagazine":{"id":"californiareportmagazine","title":"The California Report Magazine","tagline":"Your state, your stories","info":"Every week, The California Report Magazine takes you on a road trip for the ears: to visit the places and meet the people who make California unique. The in-depth storytelling podcast from the California Report.","airtime":"FRI 4:30pm-5pm, 6:30pm-7pm, 11pm-11:30pm","imageSrc":"https://cdn.kqed.org/wp-content/uploads/2024/04/The-California-Report-Magazine-Podcast-Tile-703x703-1.jpg","officialWebsiteLink":"/californiareportmagazine","meta":{"site":"news","source":"kqed","order":"10"},"link":"/californiareportmagazine","subscribe":{"apple":"https://podcasts.apple.com/us/podcast/the-california-report-magazine/id1314750545","google":"https://podcasts.google.com/feed/aHR0cHM6Ly9mZWVkcy5tZWdhcGhvbmUuZm0vS1FJTkM3NjkwNjk1OTAz","npr":"https://www.npr.org/podcasts/564733126/the-california-report-magazine","stitcher":"https://www.stitcher.com/podcast/kqed/the-california-report-magazine","rss":"https://ww2.kqed.org/news/tag/tcrmag/feed/podcast"}},"theleap":{"id":"theleap","title":"The Leap","tagline":"What if you closed your eyes, and jumped?","info":"Stories about people making dramatic, risky changes, told by award-winning public radio reporter Judy Campbell.","imageSrc":"https://cdn.kqed.org/wp-content/uploads/2024/04/The-Leap-Podcast-Tile-703x703-1.jpg","imageAlt":"KQED The Leap","officialWebsiteLink":"/podcasts/theleap","meta":{"site":"news","source":"kqed","order":"14"},"link":"/podcasts/theleap","subscribe":{"apple":"https://podcasts.apple.com/us/podcast/the-leap/id1046668171","google":"https://podcasts.google.com/feed/aHR0cHM6Ly9mZWVkcy5tZWdhcGhvbmUuZm0vS1FJTkM0NTcwODQ2MjY2","npr":"https://www.npr.org/podcasts/447248267/the-leap","stitcher":"https://www.stitcher.com/podcast/kqed/the-leap","spotify":"https://open.spotify.com/show/3sSlVHHzU0ytLwuGs1SD1U","rss":"https://ww2.kqed.org/news/programs/the-leap/feed/podcast"}},"masters-of-scale":{"id":"masters-of-scale","title":"Masters of Scale","info":"Masters of Scale is an original podcast in which LinkedIn co-founder and Greylock Partner Reid Hoffman sets out to describe and prove theories that explain how great entrepreneurs take their companies from zero to a gazillion in ingenious fashion.","airtime":"Every other Wednesday June 12 through October 16 at 8pm (repeats Thursdays at 2am)","imageSrc":"https://cdn.kqed.org/wp-content/uploads/2024/04/Masters-of-Scale-Podcast-Tile-360x360-1.jpg","officialWebsiteLink":"https://mastersofscale.com/","meta":{"site":"radio","source":"WaitWhat"},"link":"/radio/program/masters-of-scale","subscribe":{"apple":"http://mastersofscale.app.link/","rss":"https://rss.art19.com/masters-of-scale"}},"the-moth-radio-hour":{"id":"the-moth-radio-hour","title":"The Moth Radio Hour","info":"Since its launch in 1997, The Moth has presented thousands of true stories, told live and without notes, to standing-room-only crowds worldwide. Moth storytellers stand alone, under a spotlight, with only a microphone and a roomful of strangers. The storyteller and the audience embark on a high-wire act of shared experience which is both terrifying and exhilarating. Since 2008, The Moth podcast has featured many of our favorite stories told live on Moth stages around the country. For information on all of our programs and live events, visit themoth.org.","airtime":"SAT 8pm-9pm and SUN 11am-12pm","imageSrc":"https://ww2.kqed.org/radio/wp-content/uploads/sites/50/2018/04/theMoth.jpg","officialWebsiteLink":"https://themoth.org/","meta":{"site":"arts","source":"prx"},"link":"/radio/program/the-moth-radio-hour","subscribe":{"apple":"https://itunes.apple.com/us/podcast/the-moth-podcast/id275699983?mt=2","tuneIn":"https://tunein.com/radio/The-Moth-p273888/","rss":"http://feeds.themoth.org/themothpodcast"}},"the-new-yorker-radio-hour":{"id":"the-new-yorker-radio-hour","title":"The New Yorker Radio Hour","info":"The New Yorker Radio Hour is a weekly program presented by the magazine's editor, David Remnick, and produced by WNYC Studios and The New Yorker. Each episode features a diverse mix of interviews, profiles, storytelling, and an occasional burst of humor inspired by the magazine, and shaped by its writers, artists, and editors. This isn't a radio version of a magazine, but something all its own, reflecting the rich possibilities of audio storytelling and conversation. Theme music for the show was composed and performed by Merrill Garbus of tUnE-YArDs.","airtime":"SAT 10am-11am","imageSrc":"https://cdn.kqed.org/wp-content/uploads/2024/04/The-New-Yorker-Podcast-Tile-360x360-1.jpg","officialWebsiteLink":"https://www.wnycstudios.org/shows/tnyradiohour","meta":{"site":"arts","source":"WNYC"},"link":"/radio/program/the-new-yorker-radio-hour","subscribe":{"apple":"https://itunes.apple.com/us/podcast/id1050430296","tuneIn":"https://tunein.com/podcasts/WNYC-Podcasts/New-Yorker-Radio-Hour-p803804/","rss":"https://feeds.feedburner.com/newyorkerradiohour"}},"the-takeaway":{"id":"the-takeaway","title":"The Takeaway","info":"The Takeaway is produced in partnership with its national audience. It delivers perspective and analysis to help us better understand the day’s news. Be a part of the American conversation on-air and online.","airtime":"MON-THU 12pm-1pm","imageSrc":"https://cdn.kqed.org/wp-content/uploads/2024/04/The-Takeaway-Podcast-Tile-360x360-1.jpg","officialWebsiteLink":"https://www.wnycstudios.org/shows/takeaway","meta":{"site":"news","source":"WNYC"},"link":"/radio/program/the-takeaway","subscribe":{"apple":"https://itunes.apple.com/us/podcast/the-takeaway/id363143310?mt=2","tuneIn":"http://tunein.com/radio/The-Takeaway-p150731/","rss":"https://feeds.feedburner.com/takeawaypodcast"}},"this-american-life":{"id":"this-american-life","title":"This American Life","info":"This American Life is a weekly public radio show, heard by 2.2 million people on more than 500 stations. Another 2.5 million people download the weekly podcast. It is hosted by Ira Glass, produced in collaboration with Chicago Public Media, delivered to stations by PRX The Public Radio Exchange, and has won all of the major broadcasting awards.","airtime":"SAT 12pm-1pm, 7pm-8pm","imageSrc":"https://ww2.kqed.org/radio/wp-content/uploads/sites/50/2018/04/thisAmericanLife.png","officialWebsiteLink":"https://www.thisamericanlife.org/","meta":{"site":"news","source":"wbez"},"link":"/radio/program/this-american-life","subscribe":{"apple":"https://itunes.apple.com/WebObjects/MZStore.woa/wa/viewPodcast?s=143441&mt=2&id=201671138&at=11l79Y&ct=nprdirectory","rss":"https://www.thisamericanlife.org/podcast/rss.xml"}},"truthbetold":{"id":"truthbetold","title":"Truth Be Told","tagline":"Advice by and for people of color","info":"We’re the friend you call after a long day, the one who gets it. Through wisdom from some of the greatest thinkers of our time, host Tonya Mosley explores what it means to grow and thrive as a Black person in America, while discovering new ways of being that serve as a portal to more love, more healing, and more joy.","airtime":"","imageSrc":"https://cdn.kqed.org/wp-content/uploads/2024/04/Truth-Be-Told-Podcast-Tile-360x360-1.jpg","imageAlt":"KQED Truth Be Told with Tonya Mosley","officialWebsiteLink":"https://www.kqed.ord/podcasts/truthbetold","meta":{"site":"news","source":"npr","order":"12"},"link":"/podcasts/truthbetold","subscribe":{"apple":"https://podcasts.apple.com/us/podcast/truth-be-told/id1462216572","google":"https://podcasts.google.com/feed/aHR0cHM6Ly93dzIua3FlZC5vcmcvbmV3cy9jYXRlZ29yeS90cnV0aC1iZS10b2xkLXBvZGNhc3QvZmVlZA","npr":"https://www.npr.org/podcasts/719210818/truth-be-told","stitcher":"https://www.stitcher.com/s?fid=398170&refid=stpr","spotify":"https://open.spotify.com/show/587DhwTBxke6uvfwDfaV5N"}},"wait-wait-dont-tell-me":{"id":"wait-wait-dont-tell-me","title":"Wait Wait... Don't Tell Me!","info":"Peter Sagal and Bill Kurtis host the weekly NPR News quiz show alongside some of the best and brightest news and entertainment personalities.","airtime":"SUN 10am-11am, SAT 11am-12pm, SAT 6pm-7pm","imageSrc":"https://cdn.kqed.org/wp-content/uploads/2024/04/Wait-Wait-Podcast-Tile-300x300-1.jpg","officialWebsiteLink":"https://www.npr.org/programs/wait-wait-dont-tell-me/","meta":{"site":"news","source":"npr"},"link":"/radio/program/wait-wait-dont-tell-me","subscribe":{"npr":"https://rpb3r.app.goo.gl/Xogv","apple":"https://itunes.apple.com/WebObjects/MZStore.woa/wa/viewPodcast?s=143441&mt=2&id=121493804&at=11l79Y&ct=nprdirectory","tuneIn":"https://tunein.com/radio/Wait-Wait-Dont-Tell-Me-p46/","rss":"https://feeds.npr.org/344098539/podcast.xml"}},"washington-week":{"id":"washington-week","title":"Washington Week","info":"For 50 years, Washington Week has been the most intelligent and up to date conversation about the most important news stories of the week. Washington Week is the longest-running news and public affairs program on PBS and features journalists -- not pundits -- lending insight and perspective to the week's important news stories.","airtime":"SAT 1:30am-2am","imageSrc":"https://ww2.kqed.org/radio/wp-content/uploads/sites/50/2018/04/washington-week.jpg","officialWebsiteLink":"http://www.pbs.org/weta/washingtonweek/","meta":{"site":"news","source":"pbs"},"link":"/radio/program/washington-week","subscribe":{"apple":"https://itunes.apple.com/us/podcast/washington-week-audio-pbs/id83324702?mt=2","tuneIn":"https://tunein.com/podcasts/Current-Affairs/Washington-Week-p693/","rss":"http://feeds.pbs.org/pbs/weta/washingtonweek-audio"}},"weekend-edition-saturday":{"id":"weekend-edition-saturday","title":"Weekend Edition Saturday","info":"Weekend Edition Saturday wraps up the week's news and offers a mix of analysis and features on a wide range of topics, including arts, sports, entertainment, and human interest stories. The two-hour program is hosted by NPR's Peabody Award-winning Scott Simon.","airtime":"SAT 5am-10am","imageSrc":"https://cdn.kqed.org/wp-content/uploads/2024/04/Weekend-Edition-Podcast-Tile-360x360-1.jpg","officialWebsiteLink":"https://www.npr.org/programs/weekend-edition-saturday/","meta":{"site":"news","source":"npr"},"link":"/radio/program/weekend-edition-saturday"},"weekend-edition-sunday":{"id":"weekend-edition-sunday","title":"Weekend Edition Sunday","info":"Weekend Edition Sunday features interviews with newsmakers, artists, scientists, politicians, musicians, writers, theologians and historians. The program has covered news events from Nelson Mandela's 1990 release from a South African prison to the capture of Saddam Hussein.","airtime":"SUN 5am-10am","imageSrc":"https://cdn.kqed.org/wp-content/uploads/2024/04/Weekend-Edition-Podcast-Tile-360x360-1.jpg","officialWebsiteLink":"https://www.npr.org/programs/weekend-edition-sunday/","meta":{"site":"news","source":"npr"},"link":"/radio/program/weekend-edition-sunday"},"world-affairs":{"id":"world-affairs","title":"World Affairs","info":"The world as we knew it is undergoing a rapid transformation…so what's next? Welcome to WorldAffairs, your guide to a changing world. We give you the context you need to navigate across borders and ideologies. Through sound-rich stories and in-depth interviews, we break down what it means to be a global citizen on a hot, crowded planet. Our hosts, Ray Suarez, Teresa Cotsirilos and Philip Yun help you make sense of an uncertain world, one story at a time.","airtime":"MON 10pm, TUE 1am, SAT 3am","imageSrc":"https://cdn.kqed.org/wp-content/uploads/2024/04/World-Affairs-Podcast-Tile-360x360-1.jpg ","officialWebsiteLink":"https://www.worldaffairs.org/","meta":{"site":"news","source":"World Affairs"},"link":"/radio/program/world-affairs","subscribe":{"apple":"https://itunes.apple.com/us/podcast/world-affairs/id101215657?mt=2","tuneIn":"https://tunein.com/radio/WorldAffairs-p1665/","rss":"https://worldaffairs.libsyn.com/rss"}},"on-shifting-ground":{"id":"on-shifting-ground","title":"On Shifting Ground with Ray Suarez","info":"Geopolitical turmoil. A warming planet. Authoritarians on the rise. We live in a chaotic world that’s rapidly shifting around us. “On Shifting Ground with Ray Suarez” explores international fault lines and how they impact us all. Each week, NPR veteran Ray Suarez hosts conversations with journalists, leaders and policy experts to help us read between the headlines – and give us hope for human resilience.","airtime":"MON 10pm, TUE 1am, SAT 3am","imageSrc":"https://ww2.kqed.org/app/uploads/2022/12/onshiftingground-600x600-1.png","officialWebsiteLink":"https://worldaffairs.org/radio-podcast/","meta":{"site":"news","source":"On Shifting Ground"},"link":"/radio/program/on-shifting-ground","subscribe":{"apple":"https://podcasts.apple.com/ie/podcast/on-shifting-ground/id101215657","rss":"https://feeds.libsyn.com/36668/rss"}},"hidden-brain":{"id":"hidden-brain","title":"Hidden Brain","info":"Shankar Vedantam uses science and storytelling to reveal the unconscious patterns that drive human behavior, shape our choices and direct our relationships.","imageSrc":"https://ww2.kqed.org/radio/wp-content/uploads/sites/50/2018/05/hiddenbrain.jpg","officialWebsiteLink":"https://www.npr.org/series/423302056/hidden-brain","airtime":"SUN 7pm-8pm","meta":{"site":"news","source":"NPR"},"link":"/radio/program/hidden-brain","subscribe":{"apple":"https://itunes.apple.com/us/podcast/hidden-brain/id1028908750?mt=2","tuneIn":"https://tunein.com/podcasts/Science-Podcasts/Hidden-Brain-p787503/","rss":"https://feeds.npr.org/510308/podcast.xml"}},"city-arts":{"id":"city-arts","title":"City Arts & Lectures","info":"A one-hour radio program to hear celebrated writers, artists and thinkers address contemporary ideas and values, often discussing the creative process. Please note: tapes or transcripts are not available","imageSrc":"https://ww2.kqed.org/radio/wp-content/uploads/sites/50/2018/05/cityartsandlecture-300x300.jpg","officialWebsiteLink":"https://www.cityarts.net/","airtime":"SUN 1pm-2pm, TUE 10pm, WED 1am","meta":{"site":"news","source":"City Arts & Lectures"},"link":"https://www.cityarts.net","subscribe":{"tuneIn":"https://tunein.com/radio/City-Arts-and-Lectures-p692/","rss":"https://www.cityarts.net/feed/"}},"white-lies":{"id":"white-lies","title":"White Lies","info":"In 1965, Rev. James Reeb was murdered in Selma, Alabama. Three men were tried and acquitted, but no one was ever held to account. Fifty years later, two journalists from Alabama return to the city where it happened, expose the lies that kept the murder from being solved and uncover a story about guilt and memory that says as much about America today as it does about the past.","imageSrc":"https://cdn.kqed.org/wp-content/uploads/2024/04/White-Lies-Podcast-Tile-360x360-1.jpg","officialWebsiteLink":"https://www.npr.org/podcasts/510343/white-lies","meta":{"site":"news","source":"npr"},"link":"/radio/program/white-lies","subscribe":{"npr":"https://rpb3r.app.goo.gl/whitelies","apple":"https://podcasts.apple.com/podcast/id1462650519?mt=2&at=11l79Y&ct=nprdirectory","google":"https://podcasts.google.com/feed/aHR0cHM6Ly9mZWVkcy5ucHIub3JnLzUxMDM0My9wb2RjYXN0LnhtbA","spotify":"https://open.spotify.com/show/12yZ2j8vxqhc0QZyRES3ft?si=LfWYEK6URA63hueKVxRLAw","rss":"https://feeds.npr.org/510343/podcast.xml"}},"rightnowish":{"id":"rightnowish","title":"Rightnowish","tagline":"Art is where you find it","info":"Rightnowish digs into life in the Bay Area right now… ish. Journalist Pendarvis Harshaw takes us to galleries painted on the sides of liquor stores in West Oakland. We'll dance in warehouses in the Bayview, make smoothies with kids in South Berkeley, and listen to classical music in a 1984 Cutlass Supreme in Richmond. Every week, Pen talks to movers and shakers about how the Bay Area shapes what they create, and how they shape the place we call home.","imageSrc":"https://cdn.kqed.org/wp-content/uploads/2024/04/Rightnowish-Podcast-Tile-500x500-1.jpg","imageAlt":"KQED Rightnowish with Pendarvis Harshaw","officialWebsiteLink":"/podcasts/rightnowish","meta":{"site":"arts","source":"kqed","order":"5"},"link":"/podcasts/rightnowish","subscribe":{"npr":"https://www.npr.org/podcasts/721590300/rightnowish","rss":"https://ww2.kqed.org/arts/programs/rightnowish/feed/podcast","apple":"https://podcasts.apple.com/us/podcast/rightnowish/id1482187648","stitcher":"https://www.stitcher.com/podcast/kqed/rightnowish","google":"https://podcasts.google.com/feed/aHR0cHM6Ly9mZWVkcy5tZWdhcGhvbmUuZm0vS1FJTkMxMjU5MTY3NDc4","spotify":"https://open.spotify.com/show/7kEJuafTzTVan7B78ttz1I"}},"jerrybrown":{"id":"jerrybrown","title":"The Political Mind of Jerry Brown","tagline":"Lessons from a lifetime in politics","info":"The Political Mind of Jerry Brown brings listeners the wisdom of the former Governor, Mayor, and presidential candidate. Scott Shafer interviewed Brown for more than 40 hours, covering the former governor's life and half-century in the political game – and Brown has some lessons he'd like to share. ","imageSrc":"https://cdn.kqed.org/wp-content/uploads/2024/04/The-Political-Mind-of-Jerry-Brown-Podcast-Tile-703x703-1.jpg","imageAlt":"KQED The Political Mind of Jerry Brown","officialWebsiteLink":"/podcasts/jerrybrown","meta":{"site":"news","source":"kqed","order":"16"},"link":"/podcasts/jerrybrown","subscribe":{"npr":"https://www.npr.org/podcasts/790253322/the-political-mind-of-jerry-brown","apple":"https://itunes.apple.com/us/podcast/id1492194549","rss":"https://ww2.kqed.org/news/series/jerrybrown/feed/podcast/","tuneIn":"http://tun.in/pjGcK","stitcher":"https://www.stitcher.com/podcast/kqed/the-political-mind-of-jerry-brown","spotify":"https://open.spotify.com/show/54C1dmuyFyKMFttY6X2j6r?si=K8SgRCoISNK6ZbjpXrX5-w","google":"https://podcasts.google.com/feed/aHR0cHM6Ly93dzIua3FlZC5vcmcvbmV3cy9zZXJpZXMvamVycnlicm93bi9mZWVkL3BvZGNhc3Qv"}},"the-splendid-table":{"id":"the-splendid-table","title":"The Splendid Table","info":"\u003cem>The Splendid Table\u003c/em> hosts our nation's conversations about cooking, sustainability and food culture.","imageSrc":"https://cdn.kqed.org/wp-content/uploads/2024/04/The-Splendid-Table-Podcast-Tile-360x360-1.jpg","officialWebsiteLink":"https://www.splendidtable.org/","airtime":"SUN 10-11 pm","meta":{"site":"radio","source":"npr"},"link":"/radio/program/the-splendid-table"}},"racesReducer":{"5921":{"id":"5921","type":"apRace","location":"State of California","raceName":"U.S. House of Representatives, District 7","raceDescription":"Top candidate wins seat.","raceType":"top2","totalVotes":158422,"precinctsReportPercentage":98.97,"eevp":99,"tabulationStatus":"Tabulation Paused","dateUpdated":"March 22, 2024","timeUpdated":"4:48 PM","source":"AP","candidates":[{"candidateName":"Doris Matsui","candidateIncumbent":true,"candidateParty":"D","voteCount":89456,"isWinner":true},{"candidateName":"Tom Silva","candidateIncumbent":false,"candidateParty":"R","voteCount":48920,"isWinner":true},{"candidateName":"David Mandel","candidateIncumbent":false,"candidateParty":"D","voteCount":20046,"isWinner":false}],"winnerDateTime":"2024-03-09T01:00:38.194Z"},"5922":{"id":"5922","type":"apRace","location":"State of California","raceName":"U.S. House of Representatives, District 8","raceDescription":"Top candidate wins seat.","raceType":"top2","totalVotes":0,"uncontested":true,"precinctsReportPercentage":0,"eevp":0,"tabulationStatus":"Tabulation Paused","dateUpdated":"March 22, 2024","timeUpdated":"4:20 PM","source":"AP","candidates":[{"candidateName":"Rudy Recile","candidateIncumbent":false,"candidateParty":"R","voteCount":0,"isWinner":true},{"candidateName":"John Garamendi","candidateIncumbent":true,"candidateParty":"D","voteCount":0,"isWinner":true}],"winnerDateTime":"2024-03-06T04:00:30.000Z"},"5924":{"id":"5924","type":"apRace","location":"State of California","raceName":"U.S. House of Representatives, District 10","raceDescription":"Top candidate wins seat.","raceType":"top2","totalVotes":185034,"precinctsReportPercentage":99.07,"eevp":99,"tabulationStatus":"Tabulation Paused","dateUpdated":"March 22, 2024","timeUpdated":"4:48 PM","source":"AP","candidates":[{"candidateName":"Mark DeSaulnier","candidateIncumbent":true,"candidateParty":"D","voteCount":121265,"isWinner":true},{"candidateName":"Katherine Piccinini","candidateIncumbent":false,"candidateParty":"R","voteCount":34883,"isWinner":true},{"candidateName":"Nolan Chen","candidateIncumbent":false,"candidateParty":"R","voteCount":19459,"isWinner":false},{"candidateName":"Joe Sweeney","candidateIncumbent":false,"candidateParty":"NPP","voteCount":7606,"isWinner":false},{"candidateName":"Mohamed Elsherbini","candidateIncumbent":false,"candidateParty":"NPP","voteCount":1821,"isWinner":false}],"winnerDateTime":"2024-03-09T01:02:32.415Z"},"5926":{"id":"5926","type":"apRace","location":"State of California","raceName":"U.S. House of Representatives, District 12","raceDescription":"Top candidate wins seat.","raceType":"top2","totalVotes":153801,"precinctsReportPercentage":98.88,"eevp":99,"tabulationStatus":"Tabulation Paused","dateUpdated":"March 20, 2024","timeUpdated":"4:41 PM","source":"AP","candidates":[{"candidateName":"Lateefah Simon","candidateIncumbent":false,"candidateParty":"D","voteCount":85905,"isWinner":true},{"candidateName":"Jennifer Tran","candidateIncumbent":false,"candidateParty":"D","voteCount":22964,"isWinner":true},{"candidateName":"Tony Daysog","candidateIncumbent":false,"candidateParty":"D","voteCount":17197,"isWinner":false},{"candidateName":"Stephen Slauson","candidateIncumbent":false,"candidateParty":"R","voteCount":9699,"isWinner":false},{"candidateName":"Glenn Kaplan","candidateIncumbent":false,"candidateParty":"D","voteCount":6785,"isWinner":false},{"candidateName":"Eric Wilson","candidateIncumbent":false,"candidateParty":"D","voteCount":4243,"isWinner":false},{"candidateName":"Abdur Sikder","candidateIncumbent":false,"candidateParty":"D","voteCount":2847,"isWinner":false},{"candidateName":"Ned Nuerge","candidateIncumbent":false,"candidateParty":"R","voteCount":2532,"isWinner":false},{"candidateName":"Andre Todd","candidateIncumbent":false,"candidateParty":"D","voteCount":1629,"isWinner":false}],"winnerDateTime":"2024-03-16T00:22:36.062Z"},"5928":{"id":"5928","type":"apRace","location":"State of California","raceName":"U.S. House of Representatives, District 14","raceDescription":"Top candidate wins seat.","raceType":"top2","totalVotes":125831,"precinctsReportPercentage":99.14,"eevp":99,"tabulationStatus":"Tabulation Paused","dateUpdated":"March 20, 2024","timeUpdated":"4:41 PM","source":"AP","candidates":[{"candidateName":"Eric Swalwell","candidateIncumbent":true,"candidateParty":"D","voteCount":83989,"isWinner":true},{"candidateName":"Vin Kruttiventi","candidateIncumbent":false,"candidateParty":"R","voteCount":22106,"isWinner":true},{"candidateName":"Alison Hayden","candidateIncumbent":false,"candidateParty":"R","voteCount":11928,"isWinner":false},{"candidateName":"Luis Reynoso","candidateIncumbent":false,"candidateParty":"R","voteCount":7808,"isWinner":false}],"winnerDateTime":"2024-03-12T00:51:36.366Z"},"5930":{"id":"5930","type":"apRace","location":"State of California","raceName":"U.S. House of Representatives, District 16","raceDescription":"Top candidate wins seat.","raceType":"top2","totalVotes":182135,"precinctsReportPercentage":98.91,"eevp":99,"tabulationStatus":"Tabulation Paused","dateUpdated":"April 3, 2024","timeUpdated":"3:04 PM","source":"AP","candidates":[{"candidateName":"Sam Liccardo","candidateIncumbent":false,"candidateParty":"D","voteCount":38489,"isWinner":true},{"candidateName":"Evan Low","candidateIncumbent":false,"candidateParty":"D","voteCount":30249,"isWinner":false},{"candidateName":"Joe Simitian","candidateIncumbent":false,"candidateParty":"D","voteCount":30249,"isWinner":false},{"candidateName":"Peter Ohtaki","candidateIncumbent":false,"candidateParty":"R","voteCount":23275,"isWinner":false},{"candidateName":"Peter Dixon","candidateIncumbent":false,"candidateParty":"D","voteCount":14673,"isWinner":false},{"candidateName":"Rishi Kumar","candidateIncumbent":false,"candidateParty":"D","voteCount":12377,"isWinner":false},{"candidateName":"Karl Ryan","candidateIncumbent":false,"candidateParty":"R","voteCount":11557,"isWinner":false},{"candidateName":"Julie Lythcott-Haims","candidateIncumbent":false,"candidateParty":"D","voteCount":11383,"isWinner":false},{"candidateName":"Ahmed Mostafa","candidateIncumbent":false,"candidateParty":"D","voteCount":5811,"isWinner":false},{"candidateName":"Greg Tanaka","candidateIncumbent":false,"candidateParty":"D","voteCount":2421,"isWinner":false},{"candidateName":"Joby Bernstein","candidateIncumbent":false,"candidateParty":"D","voteCount":1651,"isWinner":false}],"winnerDateTime":"2024-03-12T00:32:05.002Z"},"5931":{"id":"5931","type":"apRace","location":"State of California","raceName":"U.S. House of Representatives, District 17","raceDescription":"Top candidate wins seat.","raceType":"top2","totalVotes":117534,"precinctsReportPercentage":98.92,"eevp":99,"tabulationStatus":"Tabulation Paused","dateUpdated":"March 22, 2024","timeUpdated":"4:20 PM","source":"AP","candidates":[{"candidateName":"Ro Khanna","candidateIncumbent":true,"candidateParty":"D","voteCount":73941,"isWinner":true},{"candidateName":"Anita Chen","candidateIncumbent":false,"candidateParty":"R","voteCount":31539,"isWinner":true},{"candidateName":"Ritesh Tandon","candidateIncumbent":false,"candidateParty":"D","voteCount":5728,"isWinner":false},{"candidateName":"Mario Ramirez","candidateIncumbent":false,"candidateParty":"D","voteCount":4491,"isWinner":false},{"candidateName":"Joe Dehn","candidateIncumbent":false,"candidateParty":"Lib","voteCount":1835,"isWinner":false}],"winnerDateTime":"2024-03-08T01:50:53.956Z"},"5932":{"id":"5932","type":"apRace","location":"State of California","raceName":"U.S. House of Representatives, District 18","raceDescription":"Top candidate wins seat.","raceType":"top2","totalVotes":96302,"precinctsReportPercentage":98.93,"eevp":98.83,"tabulationStatus":"Tabulation Paused","dateUpdated":"March 25, 2024","timeUpdated":"5:47 AM","source":"AP","candidates":[{"candidateName":"Zoe Lofgren","candidateIncumbent":true,"candidateParty":"D","voteCount":49323,"isWinner":true},{"candidateName":"Peter Hernandez","candidateIncumbent":false,"candidateParty":"R","voteCount":31622,"isWinner":true},{"candidateName":"Charlene Nijmeh","candidateIncumbent":false,"candidateParty":"D","voteCount":10614,"isWinner":false},{"candidateName":"Lawrence Milan","candidateIncumbent":false,"candidateParty":"D","voteCount":2712,"isWinner":false},{"candidateName":"Luele Kifle","candidateIncumbent":false,"candidateParty":"D","voteCount":2031,"isWinner":false}],"winnerDateTime":"2024-03-12T00:26:02.706Z"},"5963":{"id":"5963","type":"apRace","location":"State of California","raceName":"State House, District 2","raceDescription":"Top candidate wins seat.","raceType":"top2","totalVotes":139085,"precinctsReportPercentage":98.62,"eevp":98.6,"tabulationStatus":"Tabulation Paused","dateUpdated":"March 22, 2024","timeUpdated":"4:20 PM","source":"AP","candidates":[{"candidateName":"Michael Greer","candidateIncumbent":false,"candidateParty":"R","voteCount":38079,"isWinner":true},{"candidateName":"Chris Rogers","candidateIncumbent":false,"candidateParty":"D","voteCount":27126,"isWinner":true},{"candidateName":"Rusty Hicks","candidateIncumbent":false,"candidateParty":"D","voteCount":25615,"isWinner":false},{"candidateName":"Ariel Kelley","candidateIncumbent":false,"candidateParty":"D","voteCount":19483,"isWinner":false},{"candidateName":"Frankie Myers","candidateIncumbent":false,"candidateParty":"D","voteCount":17694,"isWinner":false},{"candidateName":"Ted Williams","candidateIncumbent":false,"candidateParty":"D","voteCount":9550,"isWinner":false},{"candidateName":"Cynthia Click","candidateIncumbent":false,"candidateParty":"D","voteCount":1538,"isWinner":false}],"winnerDateTime":"2024-03-22T21:38:36.711Z"},"5972":{"id":"5972","type":"apRace","location":"State of California","raceName":"State House, District 11","raceDescription":"Top candidate wins seat.","raceType":"top2","totalVotes":99775,"precinctsReportPercentage":99,"eevp":99,"tabulationStatus":"Tabulation Paused","dateUpdated":"March 22, 2024","timeUpdated":"4:48 PM","source":"AP","candidates":[{"candidateName":"Lori Wilson","candidateIncumbent":true,"candidateParty":"D","voteCount":50085,"isWinner":true},{"candidateName":"Dave Ennis","candidateIncumbent":false,"candidateParty":"R","voteCount":26074,"isWinner":true},{"candidateName":"Wanda Wallis","candidateIncumbent":false,"candidateParty":"R","voteCount":14638,"isWinner":false},{"candidateName":"Jeffrey Flack","candidateIncumbent":false,"candidateParty":"D","voteCount":8978,"isWinner":false}],"winnerDateTime":"2024-03-08T02:01:24.524Z"},"5973":{"id":"5973","type":"apRace","location":"State of California","raceName":"State House, District 12","raceDescription":"Top candidate wins seat.","raceType":"top2","totalVotes":143532,"precinctsReportPercentage":99.19,"eevp":99,"tabulationStatus":"Tabulation Paused","dateUpdated":"March 22, 2024","timeUpdated":"4:38 PM","source":"AP","candidates":[{"candidateName":"Damon Connolly","candidateIncumbent":true,"candidateParty":"D","voteCount":111275,"isWinner":true},{"candidateName":"Andy Podshadley","candidateIncumbent":false,"candidateParty":"R","voteCount":17240,"isWinner":true},{"candidateName":"Eryn Cervantes","candidateIncumbent":false,"candidateParty":"R","voteCount":15017,"isWinner":false}],"winnerDateTime":"2024-03-21T00:25:32.262Z"},"5975":{"id":"5975","type":"apRace","location":"State of California","raceName":"State House, District 14","raceDescription":"Top candidate wins seat.","raceType":"top2","totalVotes":106997,"precinctsReportPercentage":99.06,"eevp":99,"tabulationStatus":"Tabulation Paused","dateUpdated":"March 22, 2024","timeUpdated":"4:48 PM","source":"AP","candidates":[{"candidateName":"Buffy Wicks","candidateIncumbent":true,"candidateParty":"D","voteCount":78678,"isWinner":true},{"candidateName":"Margot Smith","candidateIncumbent":false,"candidateParty":"D","voteCount":18251,"isWinner":true},{"candidateName":"Utkarsh Jain","candidateIncumbent":false,"candidateParty":"R","voteCount":10068,"isWinner":false}],"winnerDateTime":"2024-03-15T01:30:34.539Z"},"5976":{"id":"5976","type":"apRace","location":"State of California","raceName":"State House, District 15","raceDescription":"Top candidate wins seat.","raceType":"top2","totalVotes":97144,"precinctsReportPercentage":98.98,"eevp":99,"tabulationStatus":"Tabulation Paused","dateUpdated":"March 22, 2024","timeUpdated":"4:48 PM","source":"AP","candidates":[{"candidateName":"Sonia Ledo","candidateIncumbent":false,"candidateParty":"R","voteCount":30946,"isWinner":true},{"candidateName":"Anamarie Farias","candidateIncumbent":false,"candidateParty":"D","voteCount":29512,"isWinner":true},{"candidateName":"Monica Wilson","candidateIncumbent":false,"candidateParty":"D","voteCount":24775,"isWinner":false},{"candidateName":"Karen Mitchoff","candidateIncumbent":false,"candidateParty":"D","voteCount":11911,"isWinner":false}],"winnerDateTime":"2024-03-14T00:19:38.858Z"},"5977":{"id":"5977","type":"apRace","location":"State of California","raceName":"State House, District 16","raceDescription":"Top candidate wins seat.","raceType":"top2","totalVotes":0,"uncontested":true,"precinctsReportPercentage":0,"eevp":0,"tabulationStatus":"Tabulation Paused","dateUpdated":"March 22, 2024","timeUpdated":"4:20 PM","source":"AP","candidates":[{"candidateName":"Joseph Rubay","candidateIncumbent":false,"candidateParty":"R","voteCount":0,"isWinner":true},{"candidateName":"Rebecca Bauer-Kahan","candidateIncumbent":true,"candidateParty":"D","voteCount":0,"isWinner":true}],"winnerDateTime":"2024-03-06T04:00:30.000Z"},"5978":{"id":"5978","type":"apRace","location":"State of California","raceName":"State House, District 17","raceDescription":"Top candidate wins seat.","raceType":"top2","totalVotes":111003,"precinctsReportPercentage":98.99,"eevp":99,"tabulationStatus":"Tabulation Paused","dateUpdated":"March 22, 2024","timeUpdated":"8:25 AM","source":"AP","candidates":[{"candidateName":"Matt Haney","candidateIncumbent":true,"candidateParty":"D","voteCount":90915,"isWinner":true},{"candidateName":"Manuel Noris-Barrera","candidateIncumbent":false,"candidateParty":"R","voteCount":13843,"isWinner":true},{"candidateName":"Otto Duke","candidateIncumbent":false,"candidateParty":"D","voteCount":6245,"isWinner":false}],"winnerDateTime":"2024-03-12T00:36:19.697Z"},"5979":{"id":"5979","type":"apRace","location":"State of California","raceName":"State House, District 18","raceDescription":"Top candidate wins seat.","raceType":"top2","totalVotes":86008,"precinctsReportPercentage":99.1,"eevp":99,"tabulationStatus":"Tabulation Paused","dateUpdated":"March 20, 2024","timeUpdated":"4:41 PM","source":"AP","candidates":[{"candidateName":"Mia Bonta","candidateIncumbent":true,"candidateParty":"D","voteCount":73040,"isWinner":true},{"candidateName":"Andre Sandford","candidateIncumbent":false,"candidateParty":"AIP","voteCount":4575,"isWinner":false},{"candidateName":"Mindy Pechenuk","candidateIncumbent":false,"candidateParty":"R","voteCount":4389,"isWinner":false},{"candidateName":"Cheyenne Kenney","candidateIncumbent":false,"candidateParty":"R","voteCount":4004,"isWinner":false}],"winnerDateTime":"2024-03-06T08:03:23.729Z"},"5980":{"id":"5980","type":"apRace","location":"State of California","raceName":"State House, District 19","raceDescription":"Top candidate wins seat.","raceType":"top2","totalVotes":113959,"precinctsReportPercentage":98.8,"eevp":99,"tabulationStatus":"Tabulation Paused","dateUpdated":"March 22, 2024","timeUpdated":"4:20 PM","source":"AP","candidates":[{"candidateName":"Catherine Stefani","candidateIncumbent":false,"candidateParty":"D","voteCount":64960,"isWinner":true},{"candidateName":"David Lee","candidateIncumbent":false,"candidateParty":"D","voteCount":33035,"isWinner":true},{"candidateName":"Nadia Flamenco","candidateIncumbent":false,"candidateParty":"R","voteCount":8335,"isWinner":false},{"candidateName":"Arjun Sodhani","candidateIncumbent":false,"candidateParty":"R","voteCount":7629,"isWinner":false}],"winnerDateTime":"2024-03-11T23:50:23.109Z"},"5981":{"id":"5981","type":"apRace","location":"State of California","raceName":"State House, District 20","raceDescription":"Top candidate wins seat.","raceType":"top2","totalVotes":0,"uncontested":true,"precinctsReportPercentage":0,"eevp":0,"tabulationStatus":"Tabulation Paused","dateUpdated":"March 20, 2024","timeUpdated":"4:36 PM","source":"AP","candidates":[{"candidateName":"Liz Ortega","candidateIncumbent":true,"candidateParty":"D","voteCount":0,"isWinner":true}],"winnerDateTime":"2024-03-06T04:00:30.000Z"},"5982":{"id":"5982","type":"apRace","location":"State of California","raceName":"State House, District 21","raceDescription":"Top candidate wins seat.","raceType":"top2","totalVotes":0,"uncontested":true,"precinctsReportPercentage":0,"eevp":0,"tabulationStatus":"Tabulation Paused","dateUpdated":"March 22, 2024","timeUpdated":"4:20 PM","source":"AP","candidates":[{"candidateName":"Mark Gilham","candidateIncumbent":false,"candidateParty":"R","voteCount":0,"isWinner":true},{"candidateName":"Diane Papan","candidateIncumbent":true,"candidateParty":"D","voteCount":0,"isWinner":true}],"winnerDateTime":"2024-03-06T04:00:30.000Z"},"5984":{"id":"5984","type":"apRace","location":"State of California","raceName":"State House, District 23","raceDescription":"Top candidate wins seat.","raceType":"top2","totalVotes":116963,"precinctsReportPercentage":98.91,"eevp":99,"tabulationStatus":"Tabulation Paused","dateUpdated":"March 22, 2024","timeUpdated":"4:20 PM","source":"AP","candidates":[{"candidateName":"Marc Berman","candidateIncumbent":true,"candidateParty":"D","voteCount":67106,"isWinner":true},{"candidateName":"Lydia Kou","candidateIncumbent":false,"candidateParty":"D","voteCount":23699,"isWinner":true},{"candidateName":"Gus Mattammal","candidateIncumbent":false,"candidateParty":"R","voteCount":13277,"isWinner":false},{"candidateName":"Allan Marson","candidateIncumbent":false,"candidateParty":"R","voteCount":12881,"isWinner":false}],"winnerDateTime":"2024-03-12T01:13:06.280Z"},"5987":{"id":"5987","type":"apRace","location":"State of California","raceName":"State House, District 26","raceDescription":"Top candidate wins seat.","raceType":"top2","totalVotes":72753,"precinctsReportPercentage":99.19,"eevp":99,"tabulationStatus":"Tabulation Paused","dateUpdated":"March 22, 2024","timeUpdated":"4:20 PM","source":"AP","candidates":[{"candidateName":"Patrick Ahrens","candidateIncumbent":false,"candidateParty":"D","voteCount":25036,"isWinner":true},{"candidateName":"Tara Sreekrishnan","candidateIncumbent":false,"candidateParty":"D","voteCount":19600,"isWinner":true},{"candidateName":"Sophie Song","candidateIncumbent":false,"candidateParty":"R","voteCount":15954,"isWinner":false},{"candidateName":"Omar Din","candidateIncumbent":false,"candidateParty":"D","voteCount":8772,"isWinner":false},{"candidateName":"Bob Goodwyn","candidateIncumbent":false,"candidateParty":"Lib","voteCount":2170,"isWinner":false},{"candidateName":"Ashish Garg","candidateIncumbent":false,"candidateParty":"NPP","voteCount":1221,"isWinner":false}],"winnerDateTime":"2024-03-13T21:06:29.070Z"},"5989":{"id":"5989","type":"apRace","location":"State of California","raceName":"State House, District 28","raceDescription":"Top candidate wins seat.","raceType":"top2","totalVotes":0,"uncontested":true,"precinctsReportPercentage":0,"eevp":0,"tabulationStatus":"Tabulation Paused","dateUpdated":"March 22, 2024","timeUpdated":"5:10 PM","source":"AP","candidates":[{"candidateName":"Gail Pellerin","candidateIncumbent":true,"candidateParty":"D","voteCount":0,"isWinner":true},{"candidateName":"Liz Lawler","candidateIncumbent":false,"candidateParty":"R","voteCount":0,"isWinner":true}],"winnerDateTime":"2024-03-06T04:00:30.000Z"},"6010":{"id":"6010","type":"apRace","location":"State of California","raceName":"State House, District 49","raceDescription":"Top candidate wins seat.","raceType":"top2","totalVotes":0,"uncontested":true,"precinctsReportPercentage":0,"eevp":0,"tabulationStatus":"Tabulation Paused","dateUpdated":"March 22, 2024","timeUpdated":"4:36 PM","source":"AP","candidates":[{"candidateName":"Mike Fong","candidateIncumbent":true,"candidateParty":"D","voteCount":0,"isWinner":true},{"candidateName":"Long Liu","candidateIncumbent":false,"candidateParty":"R","voteCount":0,"isWinner":true}],"winnerDateTime":"2024-03-06T04:00:30.000Z"},"6018":{"id":"6018","type":"apRace","location":"State of California","raceName":"U.S. House of Representatives, District 2","raceDescription":"Top candidate wins seat.","raceType":"top2","totalVotes":229348,"precinctsReportPercentage":99.05,"eevp":99,"tabulationStatus":"Tabulation Paused","dateUpdated":"March 22, 2024","timeUpdated":"4:38 PM","source":"AP","candidates":[{"candidateName":"Jared Huffman","candidateIncumbent":true,"candidateParty":"D","voteCount":169005,"isWinner":true},{"candidateName":"Chris Coulombe","candidateIncumbent":false,"candidateParty":"R","voteCount":37372,"isWinner":true},{"candidateName":"Tief Gibbs","candidateIncumbent":false,"candidateParty":"R","voteCount":18437,"isWinner":false},{"candidateName":"Jolian Kangas","candidateIncumbent":false,"candidateParty":"NPP","voteCount":3166,"isWinner":false},{"candidateName":"Jason Brisendine","candidateIncumbent":false,"candidateParty":"NPP","voteCount":1368,"isWinner":false}],"winnerDateTime":"2024-03-12T00:46:10.103Z"},"6020":{"id":"6020","type":"apRace","location":"State of California","raceName":"U.S. House of Representatives, District 4","raceDescription":"Top candidate wins seat.","raceType":"top2","totalVotes":187640,"precinctsReportPercentage":96.32,"eevp":96.36,"tabulationStatus":"Tabulation Paused","dateUpdated":"March 22, 2024","timeUpdated":"4:20 PM","source":"AP","candidates":[{"candidateName":"Mike Thompson","candidateIncumbent":true,"candidateParty":"D","voteCount":118147,"isWinner":true},{"candidateName":"John Munn","candidateIncumbent":false,"candidateParty":"R","voteCount":56232,"isWinner":true},{"candidateName":"Andrew Engdahl","candidateIncumbent":false,"candidateParty":"D","voteCount":11202,"isWinner":false},{"candidateName":"Niket Patwardhan","candidateIncumbent":false,"candidateParty":"NPP","voteCount":2059,"isWinner":false}],"winnerDateTime":"2024-03-07T00:30:57.980Z"},"6025":{"id":"6025","type":"apRace","location":"State of California","raceName":"U.S. House of Representatives, District 9","raceDescription":"Top candidate wins seat.","raceType":"top2","totalVotes":121271,"precinctsReportPercentage":99.17,"eevp":99,"tabulationStatus":"Tabulation Paused","dateUpdated":"March 22, 2024","timeUpdated":"5:10 PM","source":"AP","candidates":[{"candidateName":"Josh Harder","candidateIncumbent":true,"candidateParty":"D","voteCount":60396,"isWinner":true},{"candidateName":"Kevin Lincoln","candidateIncumbent":false,"candidateParty":"R","voteCount":36346,"isWinner":true},{"candidateName":"John McBride","candidateIncumbent":false,"candidateParty":"R","voteCount":15525,"isWinner":false},{"candidateName":"Khalid Jafri","candidateIncumbent":false,"candidateParty":"R","voteCount":9004,"isWinner":false}],"winnerDateTime":"2024-03-12T00:49:44.113Z"},"6031":{"id":"6031","type":"apRace","location":"State of California","raceName":"U.S. House of Representatives, District 15","raceDescription":"Top candidate wins seat.","raceType":"top2","totalVotes":0,"uncontested":true,"precinctsReportPercentage":0,"eevp":0,"tabulationStatus":"Tabulation Paused","dateUpdated":"March 22, 2024","timeUpdated":"4:20 PM","source":"AP","candidates":[{"candidateName":"Anna Kramer","candidateIncumbent":false,"candidateParty":"R","voteCount":0,"isWinner":true},{"candidateName":"Kevin Mullin","candidateIncumbent":true,"candidateParty":"D","voteCount":0,"isWinner":true}],"winnerDateTime":"2024-03-06T04:00:30.000Z"},"6035":{"id":"6035","type":"apRace","location":"State of California","raceName":"U.S. House of Representatives, District 19","raceDescription":"Top candidate wins seat.","raceType":"top2","totalVotes":203670,"precinctsReportPercentage":99.11,"eevp":99,"tabulationStatus":"Tabulation Paused","dateUpdated":"March 25, 2024","timeUpdated":"5:47 AM","source":"AP","candidates":[{"candidateName":"Jimmy Panetta","candidateIncumbent":true,"candidateParty":"D","voteCount":132540,"isWinner":true},{"candidateName":"Jason Anderson","candidateIncumbent":false,"candidateParty":"R","voteCount":58120,"isWinner":true},{"candidateName":"Sean Dougherty","candidateIncumbent":false,"candidateParty":"Grn","voteCount":13010,"isWinner":false}],"winnerDateTime":"2024-03-07T00:23:46.779Z"},"6066":{"id":"6066","type":"apRace","location":"State of California","raceName":"State House, District 3","raceDescription":"Top candidate wins seat.","raceType":"top2","totalVotes":0,"uncontested":true,"precinctsReportPercentage":0,"eevp":0,"tabulationStatus":"Tabulation Paused","dateUpdated":"March 22, 2024","timeUpdated":"5:10 PM","source":"AP","candidates":[{"candidateName":"Jamie Gallagher","candidateIncumbent":true,"candidateParty":"R","voteCount":0,"isWinner":true},{"candidateName":"Aaron Draper","candidateIncumbent":false,"candidateParty":"D","voteCount":0,"isWinner":true}],"winnerDateTime":"2024-03-06T04:00:30.000Z"},"6067":{"id":"6067","type":"apRace","location":"State of California","raceName":"State House, District 4","raceDescription":"Top candidate wins seat.","raceType":"top2","totalVotes":0,"uncontested":true,"precinctsReportPercentage":0,"eevp":0,"tabulationStatus":"Tabulation Paused","dateUpdated":"March 22, 2024","timeUpdated":"4:20 PM","source":"AP","candidates":[{"candidateName":"Cecilia Aguiar-Curry","candidateIncumbent":true,"candidateParty":"D","voteCount":0,"isWinner":true}],"winnerDateTime":"2024-03-06T04:00:30.000Z"},"6087":{"id":"6087","type":"apRace","location":"State of California","raceName":"State House, District 24","raceDescription":"Top candidate wins seat.","raceType":"top2","totalVotes":66643,"precinctsReportPercentage":99.19,"eevp":99,"tabulationStatus":"Tabulation Paused","dateUpdated":"March 22, 2024","timeUpdated":"4:20 PM","source":"AP","candidates":[{"candidateName":"Alex Lee","candidateIncumbent":true,"candidateParty":"D","voteCount":45544,"isWinner":true},{"candidateName":"Bob Brunton","candidateIncumbent":false,"candidateParty":"R","voteCount":14951,"isWinner":true},{"candidateName":"Marti Souza","candidateIncumbent":false,"candidateParty":"R","voteCount":6148,"isWinner":false}],"winnerDateTime":"2024-03-14T23:23:49.770Z"},"6088":{"id":"6088","type":"apRace","location":"State of California","raceName":"State House, District 25","raceDescription":"Top candidate wins seat.","raceType":"top2","totalVotes":69560,"precinctsReportPercentage":99.31,"eevp":99,"tabulationStatus":"Tabulation Paused","dateUpdated":"March 22, 2024","timeUpdated":"4:20 PM","source":"AP","candidates":[{"candidateName":"Ash Kalra","candidateIncumbent":true,"candidateParty":"D","voteCount":35821,"isWinner":true},{"candidateName":"Ted Stroll","candidateIncumbent":false,"candidateParty":"R","voteCount":18255,"isWinner":true},{"candidateName":"Lan Ngo","candidateIncumbent":false,"candidateParty":"D","voteCount":15484,"isWinner":false}],"winnerDateTime":"2024-03-14T02:40:57.200Z"},"6092":{"id":"6092","type":"apRace","location":"State of California","raceName":"State House, District 29","raceDescription":"Top candidate wins seat.","raceType":"top2","totalVotes":0,"uncontested":true,"precinctsReportPercentage":0,"eevp":0,"tabulationStatus":"Tabulation Paused","dateUpdated":"March 25, 2024","timeUpdated":"5:47 AM","source":"AP","candidates":[{"candidateName":"Robert Rivas","candidateIncumbent":true,"candidateParty":"D","voteCount":0,"isWinner":true},{"candidateName":"J.W. Paine","candidateIncumbent":false,"candidateParty":"R","voteCount":0,"isWinner":true}],"winnerDateTime":"2024-03-06T04:00:30.000Z"},"6223":{"id":"6223","type":"apRace","location":"State of California","raceName":"U.S. House of Representatives, District 46","raceDescription":"Top candidate wins seat.","raceType":"top2","totalVotes":0,"uncontested":true,"precinctsReportPercentage":0,"eevp":0,"tabulationStatus":"Tabulation Paused","dateUpdated":"March 22, 2024","timeUpdated":"5:16 PM","source":"AP","candidates":[{"candidateName":"Lou Correa","candidateIncumbent":true,"candidateParty":"D","voteCount":0,"isWinner":true},{"candidateName":"David Pan","candidateIncumbent":false,"candidateParty":"R","voteCount":0,"isWinner":true}],"winnerDateTime":"2024-03-06T04:00:30.000Z"},"6530":{"id":"6530","type":"apRace","location":"State of California","raceName":"State Senate, District 3","raceDescription":"Top candidate wins seat.","raceType":"top2","totalVotes":222193,"precinctsReportPercentage":98.99,"eevp":99,"tabulationStatus":"Tabulation Paused","dateUpdated":"March 22, 2024","timeUpdated":"4:48 PM","source":"AP","candidates":[{"candidateName":"Thom Bogue","candidateIncumbent":false,"candidateParty":"R","voteCount":61776,"isWinner":true},{"candidateName":"Christopher Cabaldon","candidateIncumbent":false,"candidateParty":"D","voteCount":59041,"isWinner":true},{"candidateName":"Rozzana Verder-Aliga","candidateIncumbent":false,"candidateParty":"D","voteCount":45546,"isWinner":false},{"candidateName":"Jackie Elward","candidateIncumbent":false,"candidateParty":"D","voteCount":41127,"isWinner":false},{"candidateName":"Jimih Jones","candidateIncumbent":false,"candidateParty":"R","voteCount":14703,"isWinner":false}],"winnerDateTime":"2024-03-15T01:24:31.539Z"},"6531":{"id":"6531","type":"apRace","location":"State of California","raceName":"State Senate, District 5","raceDescription":"Top candidate wins seat.","raceType":"top2","totalVotes":171623,"precinctsReportPercentage":99.09,"eevp":99,"tabulationStatus":"Tabulation Paused","dateUpdated":"March 22, 2024","timeUpdated":"5:10 PM","source":"AP","candidates":[{"candidateName":"Jim Shoemaker","candidateIncumbent":false,"candidateParty":"R","voteCount":74935,"isWinner":true},{"candidateName":"Jerry McNerney","candidateIncumbent":false,"candidateParty":"D","voteCount":57040,"isWinner":true},{"candidateName":"Carlos Villapudua","candidateIncumbent":false,"candidateParty":"D","voteCount":39648,"isWinner":false}],"winnerDateTime":"2024-03-13T20:07:46.382Z"},"6532":{"id":"6532","type":"apRace","location":"State of California","raceName":"State Senate, District 7","raceDescription":"Top candidate wins seat.","raceType":"top2","totalVotes":192446,"precinctsReportPercentage":98.72,"eevp":98.78,"tabulationStatus":"Tabulation Paused","dateUpdated":"March 22, 2024","timeUpdated":"4:48 PM","source":"AP","candidates":[{"candidateName":"Jesse Arreguín","candidateIncumbent":false,"candidateParty":"D","voteCount":61837,"isWinner":true},{"candidateName":"Jovanka Beckles","candidateIncumbent":false,"candidateParty":"D","voteCount":34025,"isWinner":true},{"candidateName":"Dan Kalb","candidateIncumbent":false,"candidateParty":"D","voteCount":28842,"isWinner":false},{"candidateName":"Kathryn Lybarger","candidateIncumbent":false,"candidateParty":"D","voteCount":28041,"isWinner":false},{"candidateName":"Sandre Swanson","candidateIncumbent":false,"candidateParty":"D","voteCount":22862,"isWinner":false},{"candidateName":"Jeanne Solnordal","candidateIncumbent":false,"candidateParty":"R","voteCount":16839,"isWinner":false}],"winnerDateTime":"2024-03-16T00:58:11.533Z"},"6533":{"id":"6533","type":"apRace","location":"State of California","raceName":"State Senate, District 9","raceDescription":"Top candidate wins seat.","raceType":"top2","totalVotes":0,"uncontested":true,"precinctsReportPercentage":0,"eevp":0,"tabulationStatus":"Tabulation Paused","dateUpdated":"March 22, 2024","timeUpdated":"4:20 PM","source":"AP","candidates":[{"candidateName":"Tim Grayson","candidateIncumbent":false,"candidateParty":"D","voteCount":0,"isWinner":true},{"candidateName":"Marisol Rubio","candidateIncumbent":false,"candidateParty":"D","voteCount":0,"isWinner":true}],"winnerDateTime":"2024-03-06T04:00:30.000Z"},"6534":{"id":"6534","type":"apRace","location":"State of California","raceName":"State Senate, District 11","raceDescription":"Top candidate wins seat.","raceType":"top2","totalVotes":228260,"precinctsReportPercentage":99.09,"eevp":99,"tabulationStatus":"Tabulation Paused","dateUpdated":"March 22, 2024","timeUpdated":"4:20 PM","source":"AP","candidates":[{"candidateName":"Scott Wiener","candidateIncumbent":true,"candidateParty":"D","voteCount":166592,"isWinner":true},{"candidateName":"Yvette Corkrean","candidateIncumbent":false,"candidateParty":"R","voteCount":34438,"isWinner":true},{"candidateName":"Cynthia Cravens","candidateIncumbent":false,"candidateParty":"D","voteCount":18513,"isWinner":false},{"candidateName":"Jing Xiong","candidateIncumbent":false,"candidateParty":"NPP","voteCount":8717,"isWinner":false}],"winnerDateTime":"2024-03-12T02:01:51.597Z"},"6535":{"id":"6535","type":"apRace","location":"State of California","raceName":"State Senate, District 13","raceDescription":"Top candidate wins seat.","raceType":"top2","totalVotes":227191,"precinctsReportPercentage":98.88,"eevp":99,"tabulationStatus":"Tabulation Paused","dateUpdated":"March 22, 2024","timeUpdated":"4:20 PM","source":"AP","candidates":[{"candidateName":"Josh Becker","candidateIncumbent":true,"candidateParty":"D","voteCount":167127,"isWinner":true},{"candidateName":"Alexander Glew","candidateIncumbent":false,"candidateParty":"R","voteCount":42788,"isWinner":true},{"candidateName":"Christina Laskowski","candidateIncumbent":false,"candidateParty":"R","voteCount":17276,"isWinner":false}],"winnerDateTime":"2024-03-12T01:56:24.964Z"},"6536":{"id":"6536","type":"apRace","location":"State of California","raceName":"State Senate, District 15","raceDescription":"Top candidate wins seat.","raceType":"top2","totalVotes":180231,"precinctsReportPercentage":98.81,"eevp":98.95,"tabulationStatus":"Tabulation Paused","dateUpdated":"March 22, 2024","timeUpdated":"4:20 PM","source":"AP","candidates":[{"candidateName":"Dave Cortese","candidateIncumbent":true,"candidateParty":"D","voteCount":124440,"isWinner":true},{"candidateName":"Robert Howell","candidateIncumbent":false,"candidateParty":"R","voteCount":34173,"isWinner":true},{"candidateName":"Tony Loaiza","candidateIncumbent":false,"candidateParty":"R","voteCount":21618,"isWinner":false}],"winnerDateTime":"2024-03-13T01:15:45.365Z"},"6548":{"id":"6548","type":"apRace","location":"State of California","raceName":"State Senate, District 39","raceDescription":"Top candidate wins seat.","raceType":"top2","totalVotes":0,"uncontested":true,"precinctsReportPercentage":0,"eevp":0,"tabulationStatus":"Tabulation Paused","dateUpdated":"March 20, 2024","timeUpdated":"4:55 PM","source":"AP","candidates":[{"candidateName":"Akilah Weber","candidateIncumbent":false,"candidateParty":"D","voteCount":0,"isWinner":true},{"candidateName":"Bob Divine","candidateIncumbent":false,"candidateParty":"R","voteCount":0,"isWinner":true}],"winnerDateTime":"2024-03-06T04:00:30.000Z"},"6611":{"id":"6611","type":"apRace","location":"State of California","raceName":"U.S. House of Representatives, District 11","raceDescription":"Top candidate wins seat.","raceType":"top2","totalVotes":188732,"precinctsReportPercentage":98.89,"eevp":99,"tabulationStatus":"Tabulation Paused","dateUpdated":"March 22, 2024","timeUpdated":"8:25 AM","source":"AP","candidates":[{"candidateName":"Nancy Pelosi","candidateIncumbent":true,"candidateParty":"D","voteCount":138285,"isWinner":true},{"candidateName":"Bruce Lou","candidateIncumbent":false,"candidateParty":"R","voteCount":16285,"isWinner":true},{"candidateName":"Marjorie Mikels","candidateIncumbent":false,"candidateParty":"D","voteCount":9363,"isWinner":false},{"candidateName":"Bianca Von Krieg","candidateIncumbent":false,"candidateParty":"D","voteCount":7634,"isWinner":false},{"candidateName":"Jason Zeng","candidateIncumbent":false,"candidateParty":"R","voteCount":6607,"isWinner":false},{"candidateName":"Jason Boyce","candidateIncumbent":false,"candidateParty":"D","voteCount":4325,"isWinner":false},{"candidateName":"Larry Nichelson","candidateIncumbent":false,"candidateParty":"R","voteCount":3482,"isWinner":false},{"candidateName":"Eve Del Castello","candidateIncumbent":false,"candidateParty":"R","voteCount":2751,"isWinner":false}],"winnerDateTime":"2024-03-12T00:31:55.445Z"},"8589":{"id":"8589","type":"apRace","location":"State of California","raceName":"U.S. Senate, Class I","raceDescription":"Top candidate wins seat.","raceType":"top2","totalVotes":7276537,"precinctsReportPercentage":99,"eevp":99,"tabulationStatus":"Tabulation Paused","dateUpdated":"March 25, 2024","timeUpdated":"5:47 AM","source":"AP","candidates":[{"candidateName":"Adam Schiff","candidateIncumbent":false,"candidateParty":"D","voteCount":2299507,"isWinner":true},{"candidateName":"Steve Garvey","candidateIncumbent":false,"candidateParty":"R","voteCount":2292414,"isWinner":true},{"candidateName":"Katie Porter","candidateIncumbent":false,"candidateParty":"D","voteCount":1115606,"isWinner":false},{"candidateName":"Barbara Lee","candidateIncumbent":false,"candidateParty":"D","voteCount":714408,"isWinner":false},{"candidateName":"Eric Early","candidateIncumbent":false,"candidateParty":"R","voteCount":240723,"isWinner":false},{"candidateName":"James Bradley","candidateIncumbent":false,"candidateParty":"R","voteCount":98180,"isWinner":false},{"candidateName":"Christina Pascucci","candidateIncumbent":false,"candidateParty":"D","voteCount":61755,"isWinner":false},{"candidateName":"Sharleta Bassett","candidateIncumbent":false,"candidateParty":"R","voteCount":54422,"isWinner":false},{"candidateName":"Sarah Liew","candidateIncumbent":false,"candidateParty":"R","voteCount":38483,"isWinner":false},{"candidateName":"Laura Garza ","candidateIncumbent":false,"candidateParty":"NPP","voteCount":34320,"isWinner":false},{"candidateName":"Jonathan Reiss","candidateIncumbent":false,"candidateParty":"R","voteCount":34283,"isWinner":false},{"candidateName":"Sepi Gilani","candidateIncumbent":false,"candidateParty":"D","voteCount":34056,"isWinner":false},{"candidateName":"Gail Lightfoot","candidateIncumbent":false,"candidateParty":"Lib","voteCount":33046,"isWinner":false},{"candidateName":"Denice Gary-Pandol","candidateIncumbent":false,"candidateParty":"R","voteCount":25494,"isWinner":false},{"candidateName":"James Macauley","candidateIncumbent":false,"candidateParty":"R","voteCount":23168,"isWinner":false},{"candidateName":"Harmesh Kumar","candidateIncumbent":false,"candidateParty":"D","voteCount":21522,"isWinner":false},{"candidateName":"David Peterson","candidateIncumbent":false,"candidateParty":"D","voteCount":21076,"isWinner":false},{"candidateName":"Douglas Pierce","candidateIncumbent":false,"candidateParty":"D","voteCount":19371,"isWinner":false},{"candidateName":"Major Singh","candidateIncumbent":false,"candidateParty":"NPP","voteCount":16965,"isWinner":false},{"candidateName":"John Rose","candidateIncumbent":false,"candidateParty":"D","voteCount":14577,"isWinner":false},{"candidateName":"Perry Pound","candidateIncumbent":false,"candidateParty":"D","voteCount":14134,"isWinner":false},{"candidateName":"Raji Rab","candidateIncumbent":false,"candidateParty":"D","voteCount":13558,"isWinner":false},{"candidateName":"Mark Ruzon","candidateIncumbent":false,"candidateParty":"NPP","voteCount":13429,"isWinner":false},{"candidateName":"Forrest Jones","candidateIncumbent":false,"candidateParty":"AIP","voteCount":13027,"isWinner":false},{"candidateName":"Stefan Simchowitz","candidateIncumbent":false,"candidateParty":"R","voteCount":12717,"isWinner":false},{"candidateName":"Martin Veprauskas","candidateIncumbent":false,"candidateParty":"R","voteCount":9714,"isWinner":false},{"candidateName":"Don Grundmann","candidateIncumbent":false,"candidateParty":"NPP","voteCount":6582,"isWinner":false}],"winnerDateTime":"2024-03-06T05:01:46.589Z"},"8686":{"id":"8686","type":"apRace","location":"State of California","raceName":"President,","raceDescription":"Top candidate wins seat.","raceType":"top1","totalVotes":3589127,"precinctsReportPercentage":99,"eevp":99,"tabulationStatus":"Tabulation Paused","dateUpdated":"March 25, 2024","timeUpdated":"5:48 AM","source":"AP","candidates":[{"candidateName":"Joe Biden","candidateIncumbent":true,"candidateParty":"D","voteCount":3200188,"isWinner":true},{"candidateName":"Marianne Williamson","candidateIncumbent":false,"candidateParty":"D","voteCount":145690,"isWinner":false},{"candidateName":"Dean Phillips","candidateIncumbent":false,"candidateParty":"D","voteCount":99981,"isWinner":false},{"candidateName":"Armando Perez-Serrato","candidateIncumbent":false,"candidateParty":"D","voteCount":42925,"isWinner":false},{"candidateName":"Gabriel Cornejo","candidateIncumbent":false,"candidateParty":"D","voteCount":41261,"isWinner":false},{"candidateName":"President Boddie","candidateIncumbent":false,"candidateParty":"D","voteCount":25373,"isWinner":false},{"candidateName":"Stephen Lyons","candidateIncumbent":false,"candidateParty":"D","voteCount":21008,"isWinner":false},{"candidateName":"Eban Cambridge","candidateIncumbent":false,"candidateParty":"D","voteCount":12701,"isWinner":false}],"winnerDateTime":"2024-03-06T04:12:27.559Z"},"8688":{"id":"8688","type":"apRace","location":"State of California","raceName":"President,","raceDescription":"Top candidate wins seat.","raceType":"top1","totalVotes":2466569,"precinctsReportPercentage":99,"eevp":99,"tabulationStatus":"Tabulation Paused","dateUpdated":"March 25, 2024","timeUpdated":"5:47 AM","source":"AP","candidates":[{"candidateName":"Donald Trump","candidateIncumbent":false,"candidateParty":"R","voteCount":1953947,"isWinner":true},{"candidateName":"Nikki Haley","candidateIncumbent":false,"candidateParty":"R","voteCount":430792,"isWinner":false},{"candidateName":"Ron DeSantis","candidateIncumbent":false,"candidateParty":"R","voteCount":35581,"isWinner":false},{"candidateName":"Chris Christie","candidateIncumbent":false,"candidateParty":"R","voteCount":20164,"isWinner":false},{"candidateName":"Vivek Ramaswamy","candidateIncumbent":false,"candidateParty":"R","voteCount":11069,"isWinner":false},{"candidateName":"Rachel Swift","candidateIncumbent":false,"candidateParty":"R","voteCount":4231,"isWinner":false},{"candidateName":"David Stuckenberg","candidateIncumbent":false,"candidateParty":"R","voteCount":3895,"isWinner":false},{"candidateName":"Ryan Binkley","candidateIncumbent":false,"candidateParty":"R","voteCount":3563,"isWinner":false},{"candidateName":"Asa Hutchinson","candidateIncumbent":false,"candidateParty":"R","voteCount":3327,"isWinner":false}],"winnerDateTime":"2024-03-06T04:13:19.766Z"},"81993":{"id":"81993","type":"apRace","location":"State of California","raceName":"U.S. Senate, Class I Unexpired Term","raceDescription":"Top candidate wins seat.","raceType":"top2","totalVotes":7358837,"precinctsReportPercentage":99,"eevp":99,"tabulationStatus":"Tabulation Paused","dateUpdated":"March 25, 2024","timeUpdated":"5:47 AM","source":"AP","candidates":[{"candidateName":"Steve Garvey","candidateIncumbent":false,"candidateParty":"R","voteCount":2444940,"isWinner":true},{"candidateName":"Adam Schiff","candidateIncumbent":false,"candidateParty":"D","voteCount":2155146,"isWinner":true},{"candidateName":"Katie Porter","candidateIncumbent":false,"candidateParty":"D","voteCount":1269194,"isWinner":false},{"candidateName":"Barbara Lee","candidateIncumbent":false,"candidateParty":"D","voteCount":863278,"isWinner":false},{"candidateName":"Eric Early","candidateIncumbent":false,"candidateParty":"R","voteCount":448788,"isWinner":false},{"candidateName":"Christina Pascucci","candidateIncumbent":false,"candidateParty":"D","voteCount":109421,"isWinner":false},{"candidateName":"Sepi Gilani","candidateIncumbent":false,"candidateParty":"D","voteCount":68070,"isWinner":false}],"winnerDateTime":"2024-03-06T04:31:08.186Z"},"82014":{"id":"82014","type":"apRace","location":"State of California","raceName":"Proposition, 1 - Behavioral Health Services Program","raceDescription":"Top candidate wins seat.","raceType":"top1","totalVotes":7221972,"precinctsReportPercentage":99,"eevp":99,"tabulationStatus":"Tabulation Paused","dateUpdated":"March 25, 2024","timeUpdated":"5:47 AM","source":"AP","candidates":[{"candidateName":"Yes","candidateIncumbent":false,"candidateParty":null,"voteCount":3624998,"isWinner":true},{"candidateName":"No","candidateIncumbent":false,"candidateParty":null,"voteCount":3596974,"isWinner":false}],"winnerDateTime":"2024-03-21T00:11:06.265Z"},"timeLoaded":"April 24, 2024 1:09 PM","nationalRacesLoaded":true,"localRacesLoaded":true,"overrides":[{"id":"5921","raceName":"U.S. House of Representatives, District 7","raceDescription":"Top two candidates advance to general election.","raceReadTheStory":""},{"id":"5922","raceName":"U.S. House of Representatives, District 8","raceDescription":"Top two candidates advance to general election.","raceReadTheStory":""},{"id":"5924","raceName":"U.S. House of Representatives, District 10","raceDescription":"Top two candidates advance to general election.","raceReadTheStory":""},{"id":"5926","raceName":"U.S. House of Representatives, District 12","raceDescription":"Top two candidates advance to general election.","raceReadTheStory":"https://www.kqed.org/elections/results/alameda/congress-12th-district"},{"id":"5928","raceName":"U.S. House of Representatives, District 14","raceDescription":"Top two candidates advance to general election.","raceReadTheStory":""},{"id":"5930","raceName":"U.S. House of Representatives, District 16","raceDescription":"Top two candidates advance to general election.","raceReadTheStory":"https://www.kqed.org/elections/results/california/congress-16th-district"},{"id":"5931","raceName":"U.S. House of Representatives, District 17","raceDescription":"Top two candidates advance to general election.","raceReadTheStory":""},{"id":"5932","raceName":"U.S. House of Representatives, District 18","raceDescription":"Top two candidates advance to general election.","raceReadTheStory":""},{"id":"5963","raceName":"State Assembly, District 2","raceDescription":"Top two candidates advance to general election.","raceReadTheStory":""},{"id":"5972","raceName":"State Assembly, District 11","raceDescription":"Top two candidates advance to general election.","raceReadTheStory":""},{"id":"5973","raceName":"State Assembly, District 12","raceDescription":"Top two candidates advance to general election.","raceReadTheStory":""},{"id":"5975","raceName":"State Assembly, District 14","raceDescription":"Top two candidates advance to general election.","raceReadTheStory":""},{"id":"5976","raceName":"State Assembly, District 15","raceDescription":"Top two candidates advance to general election.","raceReadTheStory":"https://www.kqed.org/elections/results/contracosta/state-assembly"},{"id":"5977","raceName":"State Assembly, District 16","raceDescription":"Top two candidates advance to general election.","raceReadTheStory":""},{"id":"5978","raceName":"State Assembly, District 17","raceDescription":"Top two candidates advance to general election.","raceReadTheStory":""},{"id":"5979","raceName":"State Assembly, District 18","raceDescription":"Top two candidates advance to general election.","raceReadTheStory":""},{"id":"5980","raceName":"State Assembly, District 19","raceDescription":"Top two candidates advance to general election.","raceReadTheStory":""},{"id":"5981","raceName":"State Assembly, District 20","raceDescription":"Top two candidates advance to general election.","raceReadTheStory":""},{"id":"5982","raceName":"State Assembly, District 21","raceDescription":"Top two candidates advance to general election.","raceReadTheStory":""},{"id":"5984","raceName":"State Assembly, District 23","raceDescription":"Top two candidates advance to general election.","raceReadTheStory":"https://www.kqed.org/elections/results/california/state-assembly-23rd-district"},{"id":"5987","raceName":"State Assembly, District 26","raceDescription":"Top two candidates advance to general election.","raceReadTheStory":"https://www.kqed.org/elections/results/santaclara/state-assembly-26th-district"},{"id":"5989","raceName":"State Assembly, District 28","raceDescription":"Top two candidates advance to general election.","raceReadTheStory":""},{"id":"6010","raceName":"State Assembly, District 4","raceDescription":"Top two candidates advance to general election.","raceReadTheStory":""},{"id":"6018","raceName":"U.S. House of Representatives, District 2","raceDescription":"Top two candidates advance to general election.","raceReadTheStory":""},{"id":"6020","raceName":"U.S. House of Representatives, District 4","raceDescription":"Top two candidates advance to general election.","raceReadTheStory":""},{"id":"6025","raceName":"U.S. House of Representatives, District 9","raceDescription":"Top two candidates advance to general election.","raceReadTheStory":""},{"id":"6031","raceName":"U.S. House of Representatives, District 15","raceDescription":"Top two candidates advance to general election.","raceReadTheStory":""},{"id":"6035","raceName":"U.S. House of Representatives, District 19","raceDescription":"Top two candidates advance to general election.","raceReadTheStory":""},{"id":"6067","raceName":"State Assembly, District 4","raceDescription":"Top two candidates advance to general election.","raceReadTheStory":""},{"id":"6087","raceName":"State Assembly, District 24","raceDescription":"Top two candidates advance to general election.","raceReadTheStory":""},{"id":"6088","raceName":"State Assembly, District 25","raceDescription":"Top two candidates advance to general election.","raceReadTheStory":""},{"id":"6092","raceName":"State Assembly, District 29","raceDescription":"Top two candidates advance to general election.","raceReadTheStory":""},{"id":"6223","raceName":"U.S. House of Representatives, District 4","raceDescription":"Top two candidates advance to general election.","raceReadTheStory":""},{"id":"6530","raceName":"State Senate, District 3","raceDescription":"Top two candidates advance to general election.","raceReadTheStory":"https://www.kqed.org/elections/results/california/state-senate-3rd-district"},{"id":"6531","raceName":"State Senate, District 5","raceDescription":"Top two candidates advance to general election.","raceReadTheStory":""},{"id":"6532","raceName":"State Senate, District 7","raceDescription":"Top two candidates advance to general election.","raceReadTheStory":"https://www.kqed.org/elections/results/california/state-senate-7th-district"},{"id":"6533","raceName":"State Senate, District 9","raceDescription":"Top two candidates advance to general election.","raceReadTheStory":""},{"id":"6534","raceName":"State Senate, District 11","raceDescription":"Top two candidates advance to general election.","raceReadTheStory":""},{"id":"6535","raceName":"State Senate, District 13","raceDescription":"Top two candidates advance to general election.","raceReadTheStory":""},{"id":"6536","raceName":"State Senate, District 15","raceDescription":"Top two candidates advance to general election.","raceReadTheStory":""},{"id":"6611","raceName":"U.S. House of Representatives, District 11","raceDescription":"Top two candidates advance to general election.","raceReadTheStory":""},{"id":"8589","raceName":"U.S. Senate (Full Term)","raceDescription":"Top two candidates advance to general election.","raceReadTheStory":"https://www.kqed.org/elections/results/california/senator"},{"id":"8686","raceName":"California Democratic Presidential Primary","raceDescription":"Candidates are competing for 496 delegates.","raceReadTheStory":"https://www.kqed.org/elections/results/president/democrat"},{"id":"8688","raceName":"California Republican Presidential Primary","raceDescription":"Candidates are competing for 169 delegates.","raceReadTheStory":"https://kqed.org/elections/results/president/republican"},{"id":"81993","raceName":"U.S. Senate (Partial/Unexpired Term)","raceDescription":"Top two candidates advance to general election."},{"id":"82014","raceName":"Proposition 1","raceDescription":"Bond and mental health reforms. Passes with majority vote.","raceReadTheStory":"https://www.kqed.org/elections/results/california/proposition-1"}],"AlamedaJudge5":{"id":"AlamedaJudge5","type":"localRace","location":"Alameda","raceName":"Superior Court Judge, Office 5","raceDescription":"Top candidate wins seat.","raceReadTheStory":"","raceType":"top1","timeUpdated":"7:02 PM","dateUpdated":"April 1, 2024","totalVotes":200601,"candidates":[{"candidateName":"Terry Wiley","candidateIncumbent":true,"candidateParty":"","voteCount":200601}]},"AlamedaJudge12":{"id":"AlamedaJudge12","type":"localRace","location":"Alameda","raceName":"Superior Court Judge, Office 12","raceDescription":"Top candidate wins seat.","raceReadTheStory":"","raceType":"top1","timeUpdated":"7:02 PM","dateUpdated":"April 1, 2024","totalVotes":240853,"candidates":[{"candidateName":"Mark Fickes","candidateIncumbent":false,"candidateParty":"","voteCount":133009},{"candidateName":"Michael P. Johnson","candidateIncumbent":false,"candidateParty":"","voteCount":107844}]},"AlamedaBoard2":{"id":"AlamedaBoard2","type":"localRace","location":"Alameda","raceName":"Board of Education, Trustee Area 2","raceDescription":"Top candidate wins seat.","raceReadTheStory":"","raceType":"top1","timeUpdated":"7:02 PM","dateUpdated":"April 1, 2024","totalVotes":33580,"candidates":[{"candidateName":"John Lewis","candidateIncumbent":false,"candidateParty":"","voteCount":6943},{"candidateName":"Angela Normand","candidateIncumbent":true,"candidateParty":"","voteCount":26637}]},"AlamedaBoard5":{"id":"AlamedaBoard5","type":"localRace","location":"Alameda","raceName":"Board of Education, Trustee Area 5","raceDescription":"Top candidate wins seat.","raceReadTheStory":"","raceType":"top1","timeUpdated":"7:02 PM","dateUpdated":"April 1, 2024","totalVotes":26072,"candidates":[{"candidateName":"Guadalupe \"Lupe\" Angulo","candidateIncumbent":false,"candidateParty":"","voteCount":7521},{"candidateName":"Janevette Cole","candidateIncumbent":true,"candidateParty":"","voteCount":13338},{"candidateName":"Joe Orlando Ramos","candidateIncumbent":false,"candidateParty":"","voteCount":5213}]},"AlamedaBoard6":{"id":"AlamedaBoard6","type":"localRace","location":"Alameda","raceName":"Board of Education, Trustee Area 6","raceDescription":"Top candidate wins seat.","raceReadTheStory":"","raceType":"top1","timeUpdated":"7:02 PM","dateUpdated":"April 1, 2024","totalVotes":30864,"candidates":[{"candidateName":"John Guerrero","candidateIncumbent":false,"candidateParty":"","voteCount":9989},{"candidateName":"Eileen McDonald","candidateIncumbent":true,"candidateParty":"","voteCount":20875}]},"AlamedaSup1":{"id":"AlamedaSup1","type":"localRace","location":"Alameda","raceName":"Board of Supervisors, District 1","raceDescription":"Candidate with majority vote wins seat. If no candidate reaches majority, top two candidates advance to runoff in general election.","raceReadTheStory":"","raceType":"top1","timeUpdated":"7:02 PM","dateUpdated":"April 1, 2024","totalVotes":41038,"candidates":[{"candidateName":"David Haubert","candidateIncumbent":true,"candidateParty":"","voteCount":41038}]},"AlamedaSup2":{"id":"AlamedaSup2","type":"localRace","location":"Alameda","raceName":"Board of Supervisors, District 2","raceDescription":"Candidate with majority vote wins seat. If no candidate reaches majority, top two candidates advance to runoff in general election.","raceReadTheStory":"","raceType":"top2","timeUpdated":"7:02 PM","dateUpdated":"April 1, 2024","totalVotes":31034,"candidates":[{"candidateName":"Elisa Márquez","candidateIncumbent":true,"candidateParty":"","voteCount":31034}]},"AlamedaSup4":{"id":"AlamedaSup4","type":"localRace","location":"Alameda","raceName":"Board of Supervisors, District 4","raceDescription":"Candidate with majority vote wins seat. If no candidate reaches majority, top two candidates advance to runoff in general election.","raceReadTheStory":"https://www.kqed.org/elections/results/alameda/supervisor-4th-district","raceType":"top2","timeUpdated":"7:02 PM","dateUpdated":"April 1, 2024","totalVotes":57007,"candidates":[{"candidateName":"Jennifer Esteen","candidateIncumbent":false,"candidateParty":"","voteCount":22400},{"candidateName":"Nate Miley","candidateIncumbent":true,"candidateParty":"","voteCount":34607}]},"AlamedaSup5":{"id":"AlamedaSup5","type":"localRace","location":"Alameda","raceName":"Board of Supervisors, District 5","raceDescription":"Candidate with majority vote wins seat. If no candidate reaches majority, top two candidates advance to runoff in general election.","raceReadTheStory":"https://www.kqed.org/elections/results/alameda/supervisor-5th-district","raceType":"top2","timeUpdated":"7:02 PM","dateUpdated":"April 1, 2024","totalVotes":81059,"candidates":[{"candidateName":"Ben Bartlett","candidateIncumbent":false,"candidateParty":"","voteCount":13518},{"candidateName":"Nikki Fortunato Bas","candidateIncumbent":false,"candidateParty":"","voteCount":27597},{"candidateName":"John J. Bauters","candidateIncumbent":false,"candidateParty":"","voteCount":16783},{"candidateName":"Ken Berrick","candidateIncumbent":false,"candidateParty":"","voteCount":7520},{"candidateName":"Omar Farmer","candidateIncumbent":false,"candidateParty":"","voteCount":1240},{"candidateName":"Gregory Hodge","candidateIncumbent":false,"candidateParty":"","voteCount":3419},{"candidateName":"Chris Moore","candidateIncumbent":false,"candidateParty":"","voteCount":7428},{"candidateName":"Gerald Pechenuk","candidateIncumbent":false,"candidateParty":"","voteCount":305},{"candidateName":"Lorrel Plimier","candidateIncumbent":false,"candidateParty":"","voteCount":3249}]},"AlamedaBoard7":{"id":"AlamedaBoard7","type":"localRace","location":"Alameda","raceName":"Flood Control & Water Conservation District Director, Zone 7, Full Term","raceDescription":"Top three candidates win seat.","raceReadTheStory":"","raceType":"top3","timeUpdated":"7:02 PM","dateUpdated":"April 1, 2024","totalVotes":134340,"candidates":[{"candidateName":"Alan Burnham","candidateIncumbent":false,"candidateParty":"","voteCount":15723},{"candidateName":"Sandy Figuers","candidateIncumbent":false,"candidateParty":"","voteCount":22454},{"candidateName":"Laurene K. Green","candidateIncumbent":false,"candidateParty":"","voteCount":30343},{"candidateName":"Kathy Narum","candidateIncumbent":true,"candidateParty":"","voteCount":23833},{"candidateName":"Seema Badar","candidateIncumbent":false,"candidateParty":"","voteCount":7468},{"candidateName":"Catherine Brown","candidateIncumbent":false,"candidateParty":"","voteCount":34519}]},"AlamedaAuditor":{"id":"AlamedaAuditor","type":"localRace","location":"Alameda","raceName":"Oakland Auditor","raceDescription":"Top candidate wins seat.","raceReadTheStory":"","raceType":"top1","timeUpdated":"7:02 PM","dateUpdated":"April 1, 2024","totalVotes":59227,"candidates":[{"candidateName":"Michael Houston","candidateIncumbent":true,"candidateParty":"","voteCount":59227}]},"AlamedaMeasureA":{"id":"AlamedaMeasureA","type":"localRace","location":"Alameda","raceName":"Measure A","raceDescription":"Alameda County. Civil service. Passes with majority vote.","raceReadTheStory":"","raceType":"yesNo","timeUpdated":"7:02 PM","dateUpdated":"April 1, 2024","totalVotes":282335,"candidates":[{"candidateName":"Yes","candidateIncumbent":false,"candidateParty":"","voteCount":167903},{"candidateName":"No","candidateIncumbent":false,"candidateParty":"","voteCount":114432}]},"AlamedaMeasureB":{"id":"AlamedaMeasureB","type":"localRace","location":"Alameda","raceName":"Measure B","raceDescription":"Alameda County. Recall rules. Passes with majority vote.","raceReadTheStory":"https://www.kqed.org/elections/results/alameda/measure-b","raceType":"yesNo","timeUpdated":"7:02 PM","dateUpdated":"April 1, 2024","totalVotes":282683,"candidates":[{"candidateName":"Yes","candidateIncumbent":false,"candidateParty":"","voteCount":182200},{"candidateName":"No","candidateIncumbent":false,"candidateParty":"","voteCount":100483}]},"AlamedaMeasureD":{"id":"AlamedaMeasureD","type":"localRace","location":"Alameda","raceName":"Measure D","raceDescription":"Oakland. Appropriations limit. Passes with majority vote.","raceReadTheStory":"","raceType":"yesNo","timeUpdated":"7:02 PM","dateUpdated":"April 1, 2024","totalVotes":79797,"candidates":[{"candidateName":"Yes","candidateIncumbent":false,"candidateParty":"","voteCount":59852},{"candidateName":"No","candidateIncumbent":false,"candidateParty":"","voteCount":19945}]},"AlamedaMeasureE":{"id":"AlamedaMeasureE","type":"localRace","location":"Alameda","raceName":"Measure E","raceDescription":"Alameda Unified School District. Parcel tax. Passes with 2/3 vote.","raceReadTheStory":"","raceType":"yesNo","timeUpdated":"7:02 PM","dateUpdated":"April 1, 2024","totalVotes":22692,"candidates":[{"candidateName":"Yes","candidateIncumbent":false,"candidateParty":"","voteCount":17280},{"candidateName":"No","candidateIncumbent":false,"candidateParty":"","voteCount":5412}]},"AlamedaMeasureF":{"id":"AlamedaMeasureF","type":"localRace","location":"Alameda","raceName":"Measure F","raceDescription":"Piedmont. Parcel tax. Passes with 2/3 vote.","raceReadTheStory":"","raceType":"yesNo","timeUpdated":"7:02 PM","dateUpdated":"April 1, 2024","totalVotes":4855,"candidates":[{"candidateName":"Yes","candidateIncumbent":false,"candidateParty":"","voteCount":3673},{"candidateName":"No","candidateIncumbent":false,"candidateParty":"","voteCount":1182}]},"AlamedaMeasureG":{"id":"AlamedaMeasureG","type":"localRace","location":"Alameda","raceName":"Measure G","raceDescription":"Albany Unified School District. Parcel tax. Passes with 2/3 vote. ","raceReadTheStory":"","raceType":"yesNo","timeUpdated":"7:02 PM","dateUpdated":"April 1, 2024","totalVotes":5898,"candidates":[{"candidateName":"Yes","candidateIncumbent":false,"candidateParty":"","voteCount":4651},{"candidateName":"No","candidateIncumbent":false,"candidateParty":"","voteCount":1247}]},"AlamedaMeasureH":{"id":"AlamedaMeasureH","type":"localRace","location":"Alameda","raceName":"Measure H","raceDescription":"Berkeley Unified School District. Parcel tax. Passes with 2/3 vote.","raceReadTheStory":"","raceType":"yesNo","timeUpdated":"7:02 PM","dateUpdated":"April 1, 2024","totalVotes":33331,"candidates":[{"candidateName":"Yes","candidateIncumbent":false,"candidateParty":"","voteCount":29418},{"candidateName":"No","candidateIncumbent":false,"candidateParty":"","voteCount":3913}]},"AlamedaMeasureI":{"id":"AlamedaMeasureI","type":"localRace","location":"Alameda","raceName":"Measure I","raceDescription":"Hayward Unified School District. School bond. Passes with 55% vote.","raceReadTheStory":"","raceType":"yesNo","timeUpdated":"7:02 PM","dateUpdated":"April 1, 2024","totalVotes":21929,"candidates":[{"candidateName":"Yes","candidateIncumbent":false,"candidateParty":"","voteCount":14151},{"candidateName":"No","candidateIncumbent":false,"candidateParty":"","voteCount":7778}]},"AlamedaMeasureJ":{"id":"AlamedaMeasureJ","type":"localRace","location":"Alameda","raceName":"Measure J","raceDescription":"San Leandro Unified School District. School bond. Passes with 55% vote.","raceReadTheStory":"","raceType":"yesNo","timeUpdated":"7:02 PM","dateUpdated":"April 1, 2024","totalVotes":12338,"candidates":[{"candidateName":"Yes","candidateIncumbent":false,"candidateParty":"","voteCount":7784},{"candidateName":"No","candidateIncumbent":false,"candidateParty":"","voteCount":4554}]},"CCD2":{"id":"CCD2","type":"localRace","location":"Contra Costa","raceName":"Board of Supervisors, District 2","raceDescription":"Candidate with majority vote wins seat. If no candidate reaches majority, top two candidates advance to runoff in general election.","raceReadTheStory":"","raceType":"yesNo","timeUpdated":"6:45 PM","dateUpdated":"March 28, 2024","totalVotes":45776,"candidates":[{"candidateName":"Candace Andersen","candidateIncumbent":true,"candidateParty":"","voteCount":45776}]},"CCD3":{"id":"CCD3","type":"localRace","location":"Contra Costa","raceName":"Board of Supervisors, District 3","raceDescription":"Candidate with majority vote wins seat. If no candidate reaches majority, top two candidates advance to runoff in general election.","raceReadTheStory":"","raceType":"top1","timeUpdated":"6:45 PM","dateUpdated":"March 28, 2024","totalVotes":25120,"candidates":[{"candidateName":"Diane Burgis","candidateIncumbent":true,"candidateParty":"","voteCount":25120}]},"CCD5":{"id":"CCD5","type":"localRace","location":"Contra Costa","raceName":"Board of Supervisors, District 5","raceDescription":"Candidate with majority vote wins seat. If no candidate reaches majority, top two candidates advance to runoff in general election.","raceReadTheStory":"https://www.kqed.org/elections/results/contracosta/supervisor-5th-district","raceType":"top2","timeUpdated":"6:45 PM","dateUpdated":"March 28, 2024","totalVotes":37045,"candidates":[{"candidateName":"Mike Barbanica","candidateIncumbent":false,"candidateParty":"","voteCount":14338},{"candidateName":"Jelani Killings","candidateIncumbent":false,"candidateParty":"","voteCount":5683},{"candidateName":"Shanelle Scales-Preston","candidateIncumbent":false,"candidateParty":"","voteCount":12993},{"candidateName":"Iztaccuauhtli Hector Gonzalez","candidateIncumbent":false,"candidateParty":"","voteCount":4031}]},"CCMeasureA":{"id":"CCMeasureA","type":"localRace","location":"Contra Costa","raceName":"Measure A","raceDescription":"Martinez. Appoint City Clerk. Passes with a majority vote.","raceReadTheStory":"","raceType":"yesNo","timeUpdated":"6:45 PM","dateUpdated":"March 28, 2024","totalVotes":11513,"candidates":[{"candidateName":"Yes","candidateIncumbent":false,"candidateParty":"","voteCount":7554},{"candidateName":"No","candidateIncumbent":false,"candidateParty":"","voteCount":3959}]},"CCMeasureB":{"id":"CCMeasureB","type":"localRace","location":"Contra Costa","raceName":"Measure B","raceDescription":"Antioch Unified School District. School bond. Passes with 55% vote.","raceReadTheStory":"","raceType":"yesNo","timeUpdated":"6:45 PM","dateUpdated":"March 28, 2024","totalVotes":17971,"candidates":[{"candidateName":"Yes","candidateIncumbent":false,"candidateParty":"","voteCount":10397},{"candidateName":"No","candidateIncumbent":false,"candidateParty":"","voteCount":7574}]},"CCMeasureC":{"id":"CCMeasureC","type":"localRace","location":"Contra Costa","raceName":"Measure C","raceDescription":"Martinez Unified School District. Parcel tax. Passes with 2/3 vote.","raceReadTheStory":"","raceType":"yesNo","timeUpdated":"6:45 PM","dateUpdated":"March 28, 2024","totalVotes":9230,"candidates":[{"candidateName":"Yes","candidateIncumbent":false,"candidateParty":"","voteCount":6917},{"candidateName":"No","candidateIncumbent":false,"candidateParty":"","voteCount":2313}]},"CCMeasureD":{"id":"CCMeasureD","type":"localRace","location":"Contra Costa","raceName":"Measure D","raceDescription":"Moraga School District. School bond. Passes with 55% vote.","raceReadTheStory":"","raceType":"yesNo","timeUpdated":"6:45 PM","dateUpdated":"March 28, 2024","totalVotes":6007,"candidates":[{"candidateName":"Yes","candidateIncumbent":false,"candidateParty":"","voteCount":4052},{"candidateName":"No","candidateIncumbent":false,"candidateParty":"","voteCount":1955}]},"MarinD2":{"id":"MarinD2","type":"localRace","location":"Marin","raceName":"Board of Supervisors, District 2","raceDescription":"Candidate with majority vote wins seat. If no candidate reaches majority, top two candidates advance to runoff in general election.","raceReadTheStory":"https://www.kqed.org/elections/results/marin/supervisor-2nd-district","raceType":"top2","timeUpdated":"6:54 PM","dateUpdated":"March 27, 2024","totalVotes":18466,"candidates":[{"candidateName":"Brian Colbert","candidateIncumbent":false,"candidateParty":"","voteCount":7971},{"candidateName":"Heather McPhail Sridharan","candidateIncumbent":false,"candidateParty":"","voteCount":4851},{"candidateName":"Ryan O'Neil","candidateIncumbent":false,"candidateParty":"","voteCount":2647},{"candidateName":"Gabe Paulson","candidateIncumbent":false,"candidateParty":"","voteCount":2997}]},"MarinD3":{"id":"MarinD3","type":"localRace","location":"Marin","raceName":"Board of Supervisors, District 3","raceDescription":"Candidate with majority vote wins seat. If no candidate reaches majority, top two candidates advance to runoff in general election.","raceReadTheStory":"","raceType":"top1","timeUpdated":"6:54 PM","dateUpdated":"March 27, 2024","totalVotes":13274,"candidates":[{"candidateName":"Stephanie Moulton-Peters","candidateIncumbent":true,"candidateParty":"","voteCount":13274}]},"MarinD4":{"id":"MarinD4","type":"localRace","location":"Marin","raceName":"Board of Supervisors, District 4","raceDescription":"Candidate with majority vote wins seat. If no candidate reaches majority, top two candidates advance to runoff in general election.","raceReadTheStory":"","raceType":"top1","timeUpdated":"6:54 PM","dateUpdated":"March 27, 2024","totalVotes":12986,"candidates":[{"candidateName":"Dennis Rodoni","candidateIncumbent":true,"candidateParty":"","voteCount":10086},{"candidateName":"Francis Drouillard","candidateIncumbent":false,"candidateParty":"","voteCount":2900}]},"MarinLarkspurCC":{"id":"MarinLarkspurCC","type":"localRace","location":"Marin","raceName":"Larkspur City Council (Short Term)","raceDescription":"Top candidate wins seat.","raceReadTheStory":"","raceType":"top1","timeUpdated":"6:54 PM","dateUpdated":"March 27, 2024","totalVotes":4176,"candidates":[{"candidateName":"Stephanie Andre","candidateIncumbent":false,"candidateParty":"","voteCount":2514},{"candidateName":"Claire Paquette","candidateIncumbent":false,"candidateParty":"","voteCount":1008},{"candidateName":"Lana Scott","candidateIncumbent":false,"candidateParty":"","voteCount":654}]},"MarinRossCouncil":{"id":"MarinRossCouncil","type":"localRace","location":"Marin","raceName":"Ross Town Council","raceDescription":"Top three candidates win seat.","raceReadTheStory":"","raceType":"top3","timeUpdated":"6:54 PM","dateUpdated":"March 27, 2024","totalVotes":1740,"candidates":[{"candidateName":"Charles William \"Bill\" Kircher, Jr.","candidateIncumbent":false,"candidateParty":"","voteCount":536},{"candidateName":"Mathew Salter","candidateIncumbent":false,"candidateParty":"","voteCount":502},{"candidateName":"Shadi Aboukhater","candidateIncumbent":false,"candidateParty":"","voteCount":187},{"candidateName":"Teri Dowling","candidateIncumbent":false,"candidateParty":"","voteCount":515}]},"MarinMeasureA":{"id":"MarinMeasureA","type":"localRace","location":"Marin","raceName":"Measure A","raceDescription":"Tamalpais Union High School District. School bond. Passes with 55% vote.","raceReadTheStory":"","raceType":"yesNo","timeUpdated":"6:54 PM","dateUpdated":"March 27, 2024","totalVotes":45345,"candidates":[{"candidateName":"Yes","candidateIncumbent":false,"candidateParty":"","voteCount":24376},{"candidateName":"No","candidateIncumbent":false,"candidateParty":"","voteCount":20969}]},"MarinMeasureB":{"id":"MarinMeasureB","type":"localRace","location":"Marin","raceName":"Measure B","raceDescription":"Petaluma Joint Union High School District. Parcel tax. Passes with 2/3 vote.","raceReadTheStory":"","raceType":"yesNo","timeUpdated":"6:54 PM","dateUpdated":"March 27, 2024","totalVotes":132,"candidates":[{"candidateName":"Yes","candidateIncumbent":false,"candidateParty":"","voteCount":62},{"candidateName":"No","candidateIncumbent":false,"candidateParty":"","voteCount":70}]},"MarinMeasureC":{"id":"MarinMeasureC","type":"localRace","location":"Marin","raceName":"Measure C","raceDescription":"Belvedere. Appropriation limit. Passes with majority vote.","raceReadTheStory":"","raceType":"yesNo","timeUpdated":"6:54 PM","dateUpdated":"March 27, 2024","totalVotes":870,"candidates":[{"candidateName":"Yes","candidateIncumbent":false,"candidateParty":"","voteCount":679},{"candidateName":"No","candidateIncumbent":false,"candidateParty":"","voteCount":191}]},"MarinMeasureD":{"id":"MarinMeasureD","type":"localRace","location":"Marin","raceName":"Measure D","raceDescription":"Larkspur. Rent stabilization. Passes with majority vote.","raceReadTheStory":"https://www.kqed.org/elections/results/marin/measure-d","raceType":"yesNo","timeUpdated":"6:54 PM","dateUpdated":"March 27, 2024","totalVotes":4955,"candidates":[{"candidateName":"Yes","candidateIncumbent":false,"candidateParty":"","voteCount":2573},{"candidateName":"No","candidateIncumbent":false,"candidateParty":"","voteCount":2382}]},"MarinMeasureE":{"id":"MarinMeasureE","type":"localRace","location":"Marin","raceName":"Measure E","raceDescription":"Ross. Special tax. Passes with 2/3 vote.","raceReadTheStory":"https://www.kqed.org/elections/results/marin/measure-e","raceType":"yesNo","timeUpdated":"6:54 PM","dateUpdated":"March 27, 2024","totalVotes":874,"candidates":[{"candidateName":"Yes","candidateIncumbent":false,"candidateParty":"","voteCount":683},{"candidateName":"No","candidateIncumbent":false,"candidateParty":"","voteCount":191}]},"MarinMeasureF":{"id":"MarinMeasureF","type":"localRace","location":"Marin","raceName":"Measure F","raceDescription":"San Anselmo. Flood Control and Water Conservation District. Passes with majority vote.","raceReadTheStory":"","raceType":"yesNo","timeUpdated":"6:54 PM","dateUpdated":"March 27, 2024","totalVotes":5193,"candidates":[{"candidateName":"Yes","candidateIncumbent":false,"candidateParty":"","voteCount":3083},{"candidateName":"No","candidateIncumbent":false,"candidateParty":"","voteCount":2110}]},"MarinMeasureG":{"id":"MarinMeasureG","type":"localRace","location":"Marin","raceName":"Measure G","raceDescription":"Bel Marin Keys Community Services District. Special tax. Passes with 2/3 vote.","raceReadTheStory":"","raceType":"yesNo","timeUpdated":"6:54 PM","dateUpdated":"March 27, 2024","totalVotes":830,"candidates":[{"candidateName":"Yes","candidateIncumbent":false,"candidateParty":"","voteCount":661},{"candidateName":"No","candidateIncumbent":false,"candidateParty":"","voteCount":169}]},"MarinMeasureH":{"id":"MarinMeasureH","type":"localRace","location":"Marin","raceName":"Measure H","raceDescription":"Marinwood Community Services District. Appropriations limit, fire protection. Passes with a majority vote.","raceReadTheStory":"","raceType":"yesNo","timeUpdated":"6:54 PM","dateUpdated":"March 27, 2024","totalVotes":1738,"candidates":[{"candidateName":"Yes","candidateIncumbent":false,"candidateParty":"","voteCount":1369},{"candidateName":"No","candidateIncumbent":false,"candidateParty":"","voteCount":369}]},"MarinMeasureI":{"id":"MarinMeasureI","type":"localRace","location":"Marin","raceName":"Measure I","raceDescription":"Marinwood Community Services District. Appropriations limit, parks. Passes with a majority vote.","raceReadTheStory":"","raceType":"yesNo","timeUpdated":"6:54 PM","dateUpdated":"March 27, 2024","totalVotes":1735,"candidates":[{"candidateName":"Yes","candidateIncumbent":false,"candidateParty":"","voteCount":1336},{"candidateName":"No","candidateIncumbent":false,"candidateParty":"","voteCount":399}]},"NapaD2":{"id":"NapaD2","type":"localRace","location":"Napa","raceName":"Board of Supervisors, District 2","raceDescription":"Candidate with majority vote wins seat. If no candidate reaches majority, top two candidates advance to runoff in general election.","raceReadTheStory":"","raceType":"top1","timeUpdated":"6:50 PM","dateUpdated":"April 3, 2024","totalVotes":8351,"candidates":[{"candidateName":"Liz Alessio","candidateIncumbent":false,"candidateParty":"","voteCount":6340},{"candidateName":"Doris Gentry","candidateIncumbent":false,"candidateParty":"","voteCount":2011}]},"NapaD4":{"id":"NapaD4","type":"localRace","location":"Napa","raceName":"Board of Supervisors, District 4","raceDescription":"Candidate with majority vote wins seat. If no candidate reaches majority, top two candidates advance to runoff in general election.","raceReadTheStory":"https://www.kqed.org/elections/results/napa/supervisor-4th-district","raceType":"top1","timeUpdated":"6:50 PM","dateUpdated":"April 3, 2024","totalVotes":7306,"candidates":[{"candidateName":"Amber Manfree","candidateIncumbent":false,"candidateParty":"","voteCount":3913},{"candidateName":"Pete Mott","candidateIncumbent":false,"candidateParty":"","voteCount":3393}]},"NapaD5":{"id":"NapaD5","type":"localRace","location":"Napa","raceName":"Board of Supervisors, District 5","raceDescription":"Candidate with majority vote wins seat. If no candidate reaches majority, top two candidates advance to runoff in general election.","raceReadTheStory":"https://www.kqed.org/elections/results/napa/supervisor-5th-district","raceType":"top1","timeUpdated":"6:50 PM","dateUpdated":"April 3, 2024","totalVotes":5356,"candidates":[{"candidateName":"Mariam Aboudamous","candidateIncumbent":false,"candidateParty":"","voteCount":2379},{"candidateName":"Belia Ramos","candidateIncumbent":true,"candidateParty":"","voteCount":2977}]},"NapaMeasureD":{"id":"NapaMeasureD","type":"localRace","location":"Napa","raceName":"Measure D","raceDescription":"Howell Mountain Elementary School District. School bond. Passes with 55% vote.","raceReadTheStory":"","raceType":"yesNo","timeUpdated":"6:50 PM","dateUpdated":"April 3, 2024","totalVotes":741,"candidates":[{"candidateName":"Yes","candidateIncumbent":false,"candidateParty":"","voteCount":367},{"candidateName":"No","candidateIncumbent":false,"candidateParty":"","voteCount":374}]},"NapaMeasureU":{"id":"NapaMeasureU","type":"localRace","location":"Napa","raceName":"Measure U","raceDescription":"Lake Berryessa Resort Improvement District. Appropriations limit. Passes with majority vote. ","raceReadTheStory":"","raceType":"yesNo","timeUpdated":"6:50 PM","dateUpdated":"April 3, 2024","totalVotes":86,"candidates":[{"candidateName":"Yes","candidateIncumbent":false,"candidateParty":"","voteCount":63},{"candidateName":"No","candidateIncumbent":false,"candidateParty":"","voteCount":23}]},"NapaMeasureU1":{"id":"NapaMeasureU1","type":"localRace","location":"Napa","raceName":"Measure U","raceDescription":"Yountville. Appropriations limit. Passes with majority vote. ","raceReadTheStory":"","raceType":"yesNo","timeUpdated":"6:50 PM","dateUpdated":"April 3, 2024","totalVotes":925,"candidates":[{"candidateName":"Yes","candidateIncumbent":false,"candidateParty":"","voteCount":793},{"candidateName":"No","candidateIncumbent":false,"candidateParty":"","voteCount":132}]},"SFJudge1":{"id":"SFJudge1","type":"localRace","location":"San Francisco","raceName":"Superior Court Judge, Seat 1","raceDescription":"Candidate with majority vote wins seat. If no candidate reaches majority, top two candidates advance to runoff in general election.","raceReadTheStory":"https://www.kqed.org/elections/results/sanfrancisco/superior-court-seat-1","raceType":"top1","timeUpdated":"6:50 PM","dateUpdated":"March 21, 2024","totalVotes":202960,"candidates":[{"candidateName":"Michael Begert","candidateIncumbent":true,"candidateParty":"","voteCount":124943},{"candidateName":"Chip Zecher","candidateIncumbent":false,"candidateParty":"","voteCount":78017}]},"SFJudge13":{"id":"SFJudge13","type":"localRace","location":"San Francisco","raceName":"Superior Court Judge, Seat 13","raceDescription":"Candidate with majority vote wins seat. If no candidate reaches majority, top two candidates advance to runoff in general election.","raceReadTheStory":"https://www.kqed.org/elections/results/sanfrancisco/superior-court-seat-13","raceType":"top1","timeUpdated":"6:50 PM","dateUpdated":"March 21, 2024","totalVotes":202386,"candidates":[{"candidateName":"Jean Myungjin Roland","candidateIncumbent":false,"candidateParty":"","voteCount":90012},{"candidateName":"Patrick S. Thompson","candidateIncumbent":true,"candidateParty":"","voteCount":112374}]},"SFPropA":{"id":"SFPropA","type":"localRace","location":"San Francisco","raceName":"Proposition A","raceDescription":"Housing bond. Passes with 2/3 vote.","raceReadTheStory":"https://www.kqed.org/elections/results/sanfrancisco/proposition-a","raceType":"yesNo","timeUpdated":"6:50 PM","dateUpdated":"March 21, 2024","totalVotes":225187,"candidates":[{"candidateName":"Yes","candidateIncumbent":false,"candidateParty":"","voteCount":158497},{"candidateName":"No","candidateIncumbent":false,"candidateParty":"","voteCount":66690}]},"SFPropB":{"id":"SFPropB","type":"localRace","location":"San Francisco","raceName":"Proposition B","raceDescription":"Police staffing. Passes with majority vote.","raceReadTheStory":"","raceType":"yesNo","timeUpdated":"6:50 PM","dateUpdated":"March 21, 2024","totalVotes":222954,"candidates":[{"candidateName":"Yes","candidateIncumbent":false,"candidateParty":"","voteCount":61580},{"candidateName":"No","candidateIncumbent":false,"candidateParty":"","voteCount":161374}]},"SFPropC":{"id":"SFPropC","type":"localRace","location":"San Francisco","raceName":"Proposition C","raceDescription":"Transfer tax exemption. Passes with majority vote.","raceReadTheStory":"","raceType":"yesNo","timeUpdated":"6:50 PM","dateUpdated":"March 21, 2024","totalVotes":220349,"candidates":[{"candidateName":"Yes","candidateIncumbent":false,"candidateParty":"","voteCount":116311},{"candidateName":"No","candidateIncumbent":false,"candidateParty":"","voteCount":104038}]},"SFPropD":{"id":"SFPropD","type":"localRace","location":"San Francisco","raceName":"Proposition D","raceDescription":"Ethics laws. Passes with majority vote.","raceReadTheStory":"","raceType":"yesNo","timeUpdated":"6:50 PM","dateUpdated":"March 21, 2024","totalVotes":222615,"candidates":[{"candidateName":"Yes","candidateIncumbent":false,"candidateParty":"","voteCount":198584},{"candidateName":"No","candidateIncumbent":false,"candidateParty":"","voteCount":24031}]},"SFPropE":{"id":"SFPropE","type":"localRace","location":"San Francisco","raceName":"Proposition E","raceDescription":"Police policies. Passes with majority vote.","raceReadTheStory":"https://www.kqed.org/elections/results/sanfrancisco/proposition-e","raceType":"yesNo","timeUpdated":"6:50 PM","dateUpdated":"March 21, 2024","totalVotes":222817,"candidates":[{"candidateName":"Yes","candidateIncumbent":false,"candidateParty":"","voteCount":120529},{"candidateName":"No","candidateIncumbent":false,"candidateParty":"","voteCount":102288}]},"SFPropF":{"id":"SFPropF","type":"localRace","location":"San Francisco","raceName":"Proposition F","raceDescription":"Drug screening. Passes with majority vote.","raceReadTheStory":"https://www.kqed.org/elections/results/sanfrancisco/proposition-f","raceType":"yesNo","timeUpdated":"6:50 PM","dateUpdated":"March 21, 2024","totalVotes":224004,"candidates":[{"candidateName":"Yes","candidateIncumbent":false,"candidateParty":"","voteCount":130214},{"candidateName":"No","candidateIncumbent":false,"candidateParty":"","voteCount":93790}]},"SFPropG":{"id":"SFPropG","type":"localRace","location":"San Francisco","raceName":"Proposition G","raceDescription":"Eighth-grade algebra. Passes with majority vote.","raceReadTheStory":"","raceType":"yesNo","timeUpdated":"6:50 PM","dateUpdated":"March 21, 2024","totalVotes":222704,"candidates":[{"candidateName":"Yes","candidateIncumbent":false,"candidateParty":"","voteCount":182066},{"candidateName":"No","candidateIncumbent":false,"candidateParty":"","voteCount":40638}]},"SMJudge4":{"id":"SMJudge4","type":"localRace","location":"San Mateo","raceName":"Superior Court Judge, Office 4","raceDescription":"Candidate with majority vote wins seat. If no candidate reaches majority, top two candidates advance to runoff in general election.","raceReadTheStory":"","raceType":"top1","timeUpdated":"6:56 PM","dateUpdated":"April 4, 2024","totalVotes":108919,"candidates":[{"candidateName":"Sarah Burdick","candidateIncumbent":false,"candidateParty":"","voteCount":108919}]},"SMD1":{"id":"SMD1","type":"localRace","location":"San Mateo","raceName":"Board of Supervisors, District 1","raceDescription":"Candidate with majority vote wins seat. If no candidate reaches majority, top two candidates advance to runoff in general election.","raceReadTheStory":"https://www.kqed.org/elections/results/sanmateo/supervisor-1st-district","raceType":"top1","timeUpdated":"6:56 PM","dateUpdated":"April 4, 2024","totalVotes":29650,"candidates":[{"candidateName":"Jackie Speier","candidateIncumbent":false,"candidateParty":"","voteCount":20353},{"candidateName":"Ann Schneider","candidateIncumbent":false,"candidateParty":"","voteCount":9297}]},"SMD4":{"id":"SMD4","type":"localRace","location":"San Mateo","raceName":"Board of Supervisors, District 4","raceDescription":"Candidate with majority vote wins seat. If no candidate reaches majority, top two candidates advance to runoff in general election.","raceReadTheStory":"https://www.kqed.org/elections/results/sanmateo/supervisor-4th-district","raceType":"top2","timeUpdated":"6:56 PM","dateUpdated":"April 4, 2024","totalVotes":22725,"candidates":[{"candidateName":"Antonio Lopez","candidateIncumbent":false,"candidateParty":"","voteCount":5730},{"candidateName":"Lisa Gauthier","candidateIncumbent":false,"candidateParty":"","voteCount":10358},{"candidateName":"Celeste Brevard","candidateIncumbent":false,"candidateParty":"","voteCount":1268},{"candidateName":"Paul Bocanegra","candidateIncumbent":false,"candidateParty":"","voteCount":1909},{"candidateName":"Maggie Cornejo","candidateIncumbent":false,"candidateParty":"","voteCount":3460}]},"SMD5":{"id":"SMD5","type":"localRace","location":"San Mateo","raceName":"Board of Supervisors, District 5","raceDescription":"Candidate with majority vote wins seat. If no candidate reaches majority, top two candidates advance to runoff in general election.","raceReadTheStory":"","raceType":"top1","timeUpdated":"6:56 PM","dateUpdated":"April 4, 2024","totalVotes":19937,"candidates":[{"candidateName":"David Canepa","candidateIncumbent":true,"candidateParty":"","voteCount":19937}]},"SMMeasureB":{"id":"SMMeasureB","type":"localRace","location":"San Mateo","raceName":"Measure B","raceDescription":"County Service Area #1 (Highlands). Special tax. Passes with 2/3 vote.","raceReadTheStory":"","raceType":"yesNo","timeUpdated":"6:56 PM","dateUpdated":"April 4, 2024","totalVotes":1549,"candidates":[{"candidateName":"Yes","candidateIncumbent":false,"candidateParty":"","voteCount":1360},{"candidateName":"No","candidateIncumbent":false,"candidateParty":"","voteCount":189}]},"SMMeasureC":{"id":"SMMeasureC","type":"localRace","location":"San Mateo","raceName":"Measure C","raceDescription":"Jefferson Elementary School District. Parcel tax. Passes with 2/3 vote","raceReadTheStory":"","raceType":"yesNo","timeUpdated":"6:56 PM","dateUpdated":"April 4, 2024","totalVotes":12234,"candidates":[{"candidateName":"Yes","candidateIncumbent":false,"candidateParty":"","voteCount":8543},{"candidateName":"No","candidateIncumbent":false,"candidateParty":"","voteCount":3691}]},"SMMeasureE":{"id":"SMMeasureE","type":"localRace","location":"San Mateo","raceName":"Measure E","raceDescription":"Woodside Elementary School District. School bond. Passes with 55% vote.","raceReadTheStory":"","raceType":"yesNo","timeUpdated":"6:56 PM","dateUpdated":"April 4, 2024","totalVotes":1392,"candidates":[{"candidateName":"Yes","candidateIncumbent":false,"candidateParty":"","voteCount":910},{"candidateName":"No","candidateIncumbent":false,"candidateParty":"","voteCount":482}]},"SMMeasureG":{"id":"SMMeasureG","type":"localRace","location":"San Mateo","raceName":"Measure G","raceDescription":"Pacifica School District. School bond. Passes with 55% vote.","raceReadTheStory":"","raceType":"yesNo","timeUpdated":"6:56 PM","dateUpdated":"April 4, 2024","totalVotes":11548,"candidates":[{"candidateName":"Yes","candidateIncumbent":false,"candidateParty":"","voteCount":7067},{"candidateName":"No","candidateIncumbent":false,"candidateParty":"","voteCount":4481}]},"SMMeasureH":{"id":"SMMeasureH","type":"localRace","location":"San Mateo","raceName":"Measure H","raceDescription":"San Carlos School District. School bond. Passes with 55% vote.","raceReadTheStory":"","raceType":"yesNo","timeUpdated":"6:56 PM","dateUpdated":"April 4, 2024","totalVotes":9938,"candidates":[{"candidateName":"Yes","candidateIncumbent":false,"candidateParty":"","voteCount":6283},{"candidateName":"No","candidateIncumbent":false,"candidateParty":"","voteCount":3655}]},"SCJudge5":{"id":"SCJudge5","type":"localRace","location":"Santa Clara","raceName":"Superior Court Judge, Office 5","raceDescription":"Candidate with majority vote wins seat. If no candidate reaches majority, top two candidates advance to runoff in general election.","raceReadTheStory":"","raceType":"top1","timeUpdated":"7:05 PM","dateUpdated":"April 4, 2024","totalVotes":301953,"candidates":[{"candidateName":"Jay Boyarsky","candidateIncumbent":false,"candidateParty":"","voteCount":142549},{"candidateName":"Nicole M. Ford","candidateIncumbent":false,"candidateParty":"","voteCount":52147},{"candidateName":"Johnene Linda Stebbins","candidateIncumbent":false,"candidateParty":"","voteCount":107257}]},"SCD2":{"id":"SCD2","type":"localRace","location":"Santa Clara","raceName":"Board of Supervisors, District 2","raceDescription":"Candidate with majority vote wins seat. If no candidate reaches majority, top two candidates advance to runoff in general election.","raceReadTheStory":"https://www.kqed.org/elections/results/santaclara/supervisor-2nd-district","raceType":"top2","timeUpdated":"7:05 PM","dateUpdated":"April 4, 2024","totalVotes":44059,"candidates":[{"candidateName":"Corina Herrera-Loera","candidateIncumbent":false,"candidateParty":"","voteCount":10519},{"candidateName":"Jennifer Margaret Celaya","candidateIncumbent":false,"candidateParty":"","voteCount":2394},{"candidateName":"Madison Nguyen","candidateIncumbent":false,"candidateParty":"","voteCount":12794},{"candidateName":"Betty Duong","candidateIncumbent":false,"candidateParty":"","voteCount":14031},{"candidateName":"Nelson McElmurry","candidateIncumbent":false,"candidateParty":"","voteCount":4321}]},"SCD3":{"id":"SCD3","type":"localRace","location":"Santa Clara","raceName":"Board of Supervisors, District 3","raceDescription":"Candidate with majority vote wins seat. If no candidate reaches majority, top two candidates advance to runoff in general election.","raceReadTheStory":"","raceType":"top1","timeUpdated":"7:05 PM","dateUpdated":"April 4, 2024","totalVotes":42549,"candidates":[{"candidateName":"Otto Lee","candidateIncumbent":true,"candidateParty":"","voteCount":42549}]},"SCD5":{"id":"SCD5","type":"localRace","location":"Santa Clara","raceName":"Board of Supervisors, District 5","raceDescription":"Candidate with majority vote wins seat. If no candidate reaches majority, top two candidates advance to runoff in general election.","raceReadTheStory":"https://www.kqed.org/elections/results/santaclara/supervisor-5th-district","raceType":"top2","timeUpdated":"7:05 PM","dateUpdated":"April 4, 2024","totalVotes":88712,"candidates":[{"candidateName":"Margaret Abe-Koga","candidateIncumbent":false,"candidateParty":"","voteCount":37172},{"candidateName":"Sally J. Lieber","candidateIncumbent":false,"candidateParty":"","voteCount":21962},{"candidateName":"Barry Chang","candidateIncumbent":false,"candidateParty":"","voteCount":6164},{"candidateName":"Peter C. Fung","candidateIncumbent":false,"candidateParty":"","voteCount":17892},{"candidateName":"Sandy Sans","candidateIncumbent":false,"candidateParty":"","voteCount":5522}]},"SCSJMayor":{"id":"SCSJMayor","type":"localRace","location":"Santa Clara","raceName":"San José Mayor","raceDescription":"Candidate with majority vote wins seat. If no candidate reaches majority, top two candidates advance to runoff in general election.","raceReadTheStory":"","raceType":"top1","timeUpdated":"7:05 PM","dateUpdated":"April 4, 2024","totalVotes":167064,"candidates":[{"candidateName":"Matt Mahan","candidateIncumbent":true,"candidateParty":"","voteCount":144701},{"candidateName":"Tyrone Wade","candidateIncumbent":false,"candidateParty":"","voteCount":22363}]},"SCSJD2":{"id":"SCSJD2","type":"localRace","location":"Santa Clara","raceName":"San José City Council, District 2","raceDescription":"Candidate with majority vote wins seat. If no candidate reaches majority, top two candidates advance to runoff in general election.","raceReadTheStory":"","raceType":"top2","timeUpdated":"7:05 PM","dateUpdated":"April 4, 2024","totalVotes":14131,"candidates":[{"candidateName":"Joe Lopez","candidateIncumbent":false,"candidateParty":"","voteCount":4950},{"candidateName":"Pamela Campos","candidateIncumbent":false,"candidateParty":"","voteCount":3436},{"candidateName":"Vanessa Sandoval","candidateIncumbent":false,"candidateParty":"","voteCount":2719},{"candidateName":"Babu Prasad","candidateIncumbent":false,"candidateParty":"","voteCount":3026}]},"SCSJD4":{"id":"SCSJD4","type":"localRace","location":"Santa Clara","raceName":"San José City Council, District 4","raceDescription":"Candidate with majority vote wins seat. If no candidate reaches majority, top two candidates advance to runoff in general election.","raceReadTheStory":"","raceType":"top1","timeUpdated":"7:05 PM","dateUpdated":"April 4, 2024","totalVotes":14322,"candidates":[{"candidateName":"Kansen Chu","candidateIncumbent":false,"candidateParty":"","voteCount":5931},{"candidateName":"David Cohen","candidateIncumbent":true,"candidateParty":"","voteCount":8391}]},"SCSJD6":{"id":"SCSJD6","type":"localRace","location":"Santa Clara","raceName":"San José City Council, District 6","raceDescription":"Candidate with majority vote wins seat. If no candidate reaches majority, top two candidates advance to runoff in general election.","raceReadTheStory":"","raceType":"top2","timeUpdated":"7:05 PM","dateUpdated":"April 4, 2024","totalVotes":25108,"candidates":[{"candidateName":"David Cohen","candidateIncumbent":false,"candidateParty":"","voteCount":9875},{"candidateName":"Alex Shoor","candidateIncumbent":false,"candidateParty":"","voteCount":3850},{"candidateName":"Angelo \"A.J.\" Pasciuti","candidateIncumbent":false,"candidateParty":"","voteCount":2688},{"candidateName":"Michael Mulcahy","candidateIncumbent":false,"candidateParty":"","voteCount":8695}]},"SCSJD8":{"id":"SCSJD8","type":"localRace","location":"Santa Clara","raceName":"San José City Council, District 8","raceDescription":"Candidate with majority vote wins seat. If no candidate reaches majority, top two candidates advance to runoff in general election.","raceReadTheStory":"","raceType":"top2","timeUpdated":"7:05 PM","dateUpdated":"April 4, 2024","totalVotes":21462,"candidates":[{"candidateName":"Tam Truong","candidateIncumbent":false,"candidateParty":"","voteCount":6982},{"candidateName":"Domingo Candelas","candidateIncumbent":true,"candidateParty":"","voteCount":8466},{"candidateName":"Sukhdev Singh Bainiwal","candidateIncumbent":false,"candidateParty":"","voteCount":5513},{"candidateName":"Surinder Kaur Dhaliwal","candidateIncumbent":false,"candidateParty":"","voteCount":501}]},"SCSJD10":{"id":"SCSJD10","type":"localRace","location":"Santa Clara","raceName":"San José City Council, District 10","raceDescription":"Candidate with majority vote wins seat. If no candidate reaches majority, top two candidates advance to runoff in general election.","raceReadTheStory":"","raceType":"top2","timeUpdated":"7:05 PM","dateUpdated":"April 4, 2024","totalVotes":22799,"candidates":[{"candidateName":"George Casey","candidateIncumbent":false,"candidateParty":"","voteCount":8805},{"candidateName":"Arjun Batra","candidateIncumbent":true,"candidateParty":"","voteCount":8354},{"candidateName":"Lenka Wright","candidateIncumbent":false,"candidateParty":"","voteCount":5640}]},"SCMeasureA":{"id":"SCMeasureA","type":"localRace","location":"Santa Clara","raceName":"Measure A","raceDescription":"Santa Clara. Appointed city clerk. Passes with majority vote.","raceReadTheStory":"","raceType":"yesNo","timeUpdated":"7:05 PM","dateUpdated":"April 4, 2024","totalVotes":20315,"candidates":[{"candidateName":"Yes","candidateIncumbent":false,"candidateParty":"","voteCount":6580},{"candidateName":"No","candidateIncumbent":false,"candidateParty":"","voteCount":13735}]},"SCMeasureB":{"id":"SCMeasureB","type":"localRace","location":"Santa Clara","raceName":"Measure B","raceDescription":"Santa Clara. Appointed police chief. Passes with majority vote.","raceReadTheStory":"","raceType":"yesNo","timeUpdated":"7:05 PM","dateUpdated":"April 4, 2024","totalVotes":20567,"candidates":[{"candidateName":"Yes","candidateIncumbent":false,"candidateParty":"","voteCount":5680},{"candidateName":"No","candidateIncumbent":false,"candidateParty":"","voteCount":14887}]},"SCMeasureC":{"id":"SCMeasureC","type":"localRace","location":"Santa Clara","raceName":"Measure C","raceDescription":"Sunnyvale School District. School bond. Passes with 55% vote.","raceReadTheStory":"","raceType":"yesNo","timeUpdated":"7:05 PM","dateUpdated":"April 4, 2024","totalVotes":14656,"candidates":[{"candidateName":"Yes","candidateIncumbent":false,"candidateParty":"","voteCount":10261},{"candidateName":"No","candidateIncumbent":false,"candidateParty":"","voteCount":4395}]},"SolanoD15":{"id":"SolanoD15","type":"localRace","location":"Solano","raceName":"Superior Court Judge, Department 15","raceDescription":"Candidate with majority vote wins seat. If no candidate reaches majority, top two candidates advance to runoff in general election.","raceReadTheStory":"","raceType":"","timeUpdated":"7:08 PM","dateUpdated":"March 28, 2024","totalVotes":81709,"candidates":[{"candidateName":"Mike Thompson","candidateIncumbent":false,"candidateParty":"","voteCount":36844},{"candidateName":"Bryan J. Kim","candidateIncumbent":false,"candidateParty":"","voteCount":44865}]},"SolanoD1":{"id":"SolanoD1","type":"localRace","location":"Solano","raceName":"Board of Supervisors, District 1","raceDescription":"Candidate with majority vote wins seat. If no candidate reaches majority, top two candidates advance to runoff in general election.","raceReadTheStory":"https://www.kqed.org/elections/results/solano/supervisor-1st-district","raceType":"","timeUpdated":"7:08 PM","dateUpdated":"March 28, 2024","totalVotes":13786,"candidates":[{"candidateName":"Michael Wilson","candidateIncumbent":false,"candidateParty":"","voteCount":6401},{"candidateName":"Cassandra James","candidateIncumbent":false,"candidateParty":"","voteCount":7385}]},"SolanoD2":{"id":"SolanoD2","type":"localRace","location":"Solano","raceName":"Board of Supervisors, District 2","raceDescription":"Candidate with majority vote wins seat. If no candidate reaches majority, top two candidates advance to runoff in general election.","raceReadTheStory":"","raceType":"","timeUpdated":"7:08 PM","dateUpdated":"March 28, 2024","totalVotes":19903,"candidates":[{"candidateName":"Monica Brown","candidateIncumbent":true,"candidateParty":"","voteCount":10951},{"candidateName":"Nora Dizon","candidateIncumbent":false,"candidateParty":"","voteCount":3135},{"candidateName":"Rochelle Sherlock","candidateIncumbent":false,"candidateParty":"","voteCount":5817}]},"SolanoD5":{"id":"SolanoD5","type":"localRace","location":"Solano","raceName":"Board of Supervisors, District 5","raceDescription":"Candidate with majority vote wins seat. If no candidate reaches majority, top two candidates advance to runoff in general election.","raceReadTheStory":"","raceType":"","timeUpdated":"7:08 PM","dateUpdated":"March 28, 2024","totalVotes":17888,"candidates":[{"candidateName":"Mitch Mashburn","candidateIncumbent":true,"candidateParty":"","voteCount":11210},{"candidateName":"Chadwick J. Ledoux","candidateIncumbent":false,"candidateParty":"","voteCount":6678}]},"SolanoEducation":{"id":"SolanoEducation","type":"localRace","location":"Solano","raceName":"Sacramento County Board of Education","raceDescription":"Candidate with majority vote wins seat. If no candidate reaches majority, top two candidates advance to runoff in general election.","raceReadTheStory":"","raceType":"","timeUpdated":"7:08 PM","dateUpdated":"March 28, 2024","totalVotes":3650,"candidates":[{"candidateName":"Heather Davis","candidateIncumbent":true,"candidateParty":"","voteCount":2960},{"candidateName":"Shazleen Khan","candidateIncumbent":false,"candidateParty":"","voteCount":690}]},"SolanoMeasureA":{"id":"SolanoMeasureA","type":"localRace","location":"Solano","raceName":"Measure A","raceDescription":"Benicia. Hotel tax. Passes with majority vote.","raceReadTheStory":"https://www.kqed.org/elections/results/solano/measure-a","raceType":"yesNo","timeUpdated":"7:08 PM","dateUpdated":"March 28, 2024","totalVotes":10136,"candidates":[{"candidateName":"Yes","candidateIncumbent":false,"candidateParty":"","voteCount":7869},{"candidateName":"No","candidateIncumbent":false,"candidateParty":"","voteCount":2267}]},"SolanoMeasureB":{"id":"SolanoMeasureB","type":"localRace","location":"Solano","raceName":"Measure B","raceDescription":"Benicia. Sales tax. Passes with majority vote.","raceReadTheStory":"https://www.kqed.org/elections/results/solano/measure-b","raceType":"yesNo","timeUpdated":"7:08 PM","dateUpdated":"March 28, 2024","totalVotes":10164,"candidates":[{"candidateName":"Yes","candidateIncumbent":false,"candidateParty":"","voteCount":7335},{"candidateName":"No","candidateIncumbent":false,"candidateParty":"","voteCount":2829}]},"SolanoMeasureC":{"id":"SolanoMeasureC","type":"localRace","location":"Solano","raceName":"Measure C","raceDescription":"Benicia Unified School District. School bond. Passes with 55% vote.","raceReadTheStory":"","raceType":"yesNo","timeUpdated":"7:08 PM","dateUpdated":"March 28, 2024","totalVotes":10112,"candidates":[{"candidateName":"Yes","candidateIncumbent":false,"candidateParty":"","voteCount":6316},{"candidateName":"No","candidateIncumbent":false,"candidateParty":"","voteCount":3796}]},"SolanoMeasureN":{"id":"SolanoMeasureN","type":"localRace","location":"Solano","raceName":"Measure N","raceDescription":"Davis Joint Unified School District. Parcel tax. Passes with 2/3 vote.","raceReadTheStory":"","raceType":"yesNo","timeUpdated":"7:08 PM","dateUpdated":"March 28, 2024","totalVotes":15,"candidates":[{"candidateName":"Yes","candidateIncumbent":false,"candidateParty":"","voteCount":5},{"candidateName":"No","candidateIncumbent":false,"candidateParty":"","voteCount":10}]},"SonomaJudge3":{"id":"SonomaJudge3","type":"localRace","location":"Sonoma","raceName":"Superior Court Judge, Office 3","raceDescription":"Candidate with majority vote wins seat. If no candidate reaches majority, top two candidates advance to runoff in general election.","raceReadTheStory":"","raceType":"top1","timeUpdated":"6:51 PM","dateUpdated":"March 29, 2024","totalVotes":115405,"candidates":[{"candidateName":"Kristine M. Burk","candidateIncumbent":false,"candidateParty":"","voteCount":79498},{"candidateName":"Beki Berrey","candidateIncumbent":false,"candidateParty":"","voteCount":35907}]},"SonomaJudge4":{"id":"SonomaJudge4","type":"localRace","location":"Sonoma","raceName":"Superior Court Judge, Office 4","raceDescription":"Candidate with majority vote wins seat. If no candidate reaches majority, top two candidates advance to runoff in general election.","raceReadTheStory":"","raceType":"top1","timeUpdated":"6:51 PM","dateUpdated":"March 29, 2024","totalVotes":86789,"candidates":[{"candidateName":"Paul J. Lozada","candidateIncumbent":false,"candidateParty":"","voteCount":86789}]},"SonomaJudge6":{"id":"SonomaJudge6","type":"localRace","location":"Sonoma","raceName":"Superior Court Judge, Office 6","raceDescription":"Candidate with majority vote wins seat. If no candidate reaches majority, top two candidates advance to runoff in general election.","raceReadTheStory":"","raceType":"top1","timeUpdated":"6:51 PM","dateUpdated":"March 29, 2024","totalVotes":117990,"candidates":[{"candidateName":"Omar Figueroa","candidateIncumbent":false,"candidateParty":"","voteCount":42236},{"candidateName":"Kenneth English","candidateIncumbent":false,"candidateParty":"","voteCount":75754}]},"SonomaD1":{"id":"SonomaD1","type":"localRace","location":"Sonoma","raceName":"Board of Supervisors, District 1","raceDescription":"Candidate with majority vote wins seat. If no candidate reaches majority, top two candidates advance to runoff in general election.","raceReadTheStory":"","raceType":"top1","timeUpdated":"6:51 PM","dateUpdated":"March 29, 2024","totalVotes":30348,"candidates":[{"candidateName":"Rebecca Hermosillo","candidateIncumbent":false,"candidateParty":"","voteCount":23958},{"candidateName":"Jonathan Mathieu","candidateIncumbent":false,"candidateParty":"","voteCount":6390}]},"SonomaD3":{"id":"SonomaD3","type":"localRace","location":"Sonoma","raceName":"Board of Supervisors, District 3","raceDescription":"Candidate with majority vote wins seat. If no candidate reaches majority, top two candidates advance to runoff in general election.","raceReadTheStory":"https://www.kqed.org/elections/results/sonoma/supervisor-3rd-district","raceType":"top1","timeUpdated":"6:51 PM","dateUpdated":"March 29, 2024","totalVotes":16312,"candidates":[{"candidateName":"Chris Coursey","candidateIncumbent":true,"candidateParty":"","voteCount":11346},{"candidateName":"Omar Medina","candidateIncumbent":false,"candidateParty":"","voteCount":4966}]},"SonomaD5":{"id":"SonomaD5","type":"localRace","location":"Sonoma","raceName":"Board of Supervisors, District 5","raceDescription":"Candidate with majority vote wins seat. If no candidate reaches majority, top two candidates advance to runoff in general election.","raceReadTheStory":"","raceType":"top1","timeUpdated":"6:51 PM","dateUpdated":"March 29, 2024","totalVotes":23356,"candidates":[{"candidateName":"Lynda Hopkins","candidateIncumbent":true,"candidateParty":"","voteCount":23356}]},"SonomaMeasureA":{"id":"SonomaMeasureA","type":"localRace","location":"Sonoma","raceName":"Measure A","raceDescription":"Cotati-Rohnert Park Unified School District. Parcel tax. Passes with 2/3 vote.","raceReadTheStory":"","raceType":"yesNo","timeUpdated":"6:51 PM","dateUpdated":"March 29, 2024","totalVotes":13756,"candidates":[{"candidateName":"Yes","candidateIncumbent":false,"candidateParty":"","voteCount":10320},{"candidateName":"No","candidateIncumbent":false,"candidateParty":"","voteCount":3436}]},"SonomaMeasureB":{"id":"SonomaMeasureB","type":"localRace","location":"Sonoma","raceName":"Measure B","raceDescription":"Petaluma Joint Union High School District. Parcel tax. Passes with 2/3 vote.","raceReadTheStory":"","raceType":"yesNo","timeUpdated":"6:51 PM","dateUpdated":"March 29, 2024","totalVotes":24877,"candidates":[{"candidateName":"Yes","candidateIncumbent":false,"candidateParty":"","voteCount":15795},{"candidateName":"No","candidateIncumbent":false,"candidateParty":"","voteCount":9082}]},"SonomaMeasureC":{"id":"SonomaMeasureC","type":"localRace","location":"Sonoma","raceName":"Measure C","raceDescription":"Fort Ross School District. School bond. Passes with 55% vote.","raceReadTheStory":"","raceType":"yesNo","timeUpdated":"6:51 PM","dateUpdated":"March 29, 2024","totalVotes":286,"candidates":[{"candidateName":"Yes","candidateIncumbent":false,"candidateParty":"","voteCount":159},{"candidateName":"No","candidateIncumbent":false,"candidateParty":"","voteCount":127}]},"SonomaMeasureD":{"id":"SonomaMeasureD","type":"localRace","location":"Sonoma","raceName":"Measure D","raceDescription":"Harmony Union School District. School bond. Passes with 55% vote.","raceReadTheStory":"","raceType":"yesNo","timeUpdated":"6:51 PM","dateUpdated":"March 29, 2024","totalVotes":1925,"candidates":[{"candidateName":"Yes","candidateIncumbent":false,"candidateParty":"","voteCount":1089},{"candidateName":"No","candidateIncumbent":false,"candidateParty":"","voteCount":836}]},"SonomaMeasureE":{"id":"SonomaMeasureE","type":"localRace","location":"Sonoma","raceName":"Measure E","raceDescription":"Petaluma City (Elementary) School District. Parcel tax. Passes with 2/3 vote.","raceReadTheStory":"","raceType":"yesNo","timeUpdated":"6:51 PM","dateUpdated":"March 29, 2024","totalVotes":11133,"candidates":[{"candidateName":"Yes","candidateIncumbent":false,"candidateParty":"","voteCount":7622},{"candidateName":"No","candidateIncumbent":false,"candidateParty":"","voteCount":3511}]},"SonomaMeasureG":{"id":"SonomaMeasureG","type":"localRace","location":"Sonoma","raceName":"Measure G","raceDescription":"Rincon Valley Union School District. School bond. Passes with 55% vote.","raceReadTheStory":"","raceType":"yesNo","timeUpdated":"6:51 PM","dateUpdated":"March 29, 2024","totalVotes":14577,"candidates":[{"candidateName":"Yes","candidateIncumbent":false,"candidateParty":"","voteCount":8668},{"candidateName":"No","candidateIncumbent":false,"candidateParty":"","voteCount":5909}]},"SonomaMeasureH":{"id":"SonomaMeasureH","type":"localRace","location":"Sonoma","raceName":"Measure H","raceDescription":"Sonoma County. Sales tax. Passes with majority vote.","raceReadTheStory":"https://www.kqed.org/elections/results/sonoma/measure-h","raceType":"yesNo","timeUpdated":"6:51 PM","dateUpdated":"March 29, 2024","totalVotes":145261,"candidates":[{"candidateName":"Yes","candidateIncumbent":false,"candidateParty":"","voteCount":89646},{"candidateName":"No","candidateIncumbent":false,"candidateParty":"","voteCount":55615}]}},"radioSchedulesReducer":{},"listsReducer":{"posts/news?program=news-fix":{"isFetching":false,"latestQuery":{"from":0,"postsToRender":9},"tag":null,"vitalsOnly":true,"totalRequested":9,"isLoading":false,"isLoadingMore":true,"total":13840,"items":["news_11644927","news_10779164","news_11844635","news_11841961","news_11835767","news_11827388","news_11818524","news_11805573","news_11780213"]}},"recallGuideReducer":{"intros":{},"policy":{},"candidates":{}},"savedPostsReducer":{},"pfsSessionReducer":{},"siteSettingsReducer":{},"subscriptionsReducer":{},"termsReducer":{"about":{"name":"About","type":"terms","id":"about","slug":"about","link":"/about","taxonomy":"site"},"arts":{"name":"Arts & Culture","grouping":["arts","pop","trulyca"],"description":"KQED Arts provides daily in-depth coverage of the Bay Area's music, art, film, performing arts, literature and arts news, as well as cultural commentary and criticism.","type":"terms","id":"arts","slug":"arts","link":"/arts","taxonomy":"site"},"artschool":{"name":"Art School","parent":"arts","type":"terms","id":"artschool","slug":"artschool","link":"/artschool","taxonomy":"site"},"bayareabites":{"name":"KQED food","grouping":["food","bayareabites","checkplease"],"parent":"food","type":"terms","id":"bayareabites","slug":"bayareabites","link":"/food","taxonomy":"site"},"bayareahiphop":{"name":"Bay Area Hiphop","type":"terms","id":"bayareahiphop","slug":"bayareahiphop","link":"/bayareahiphop","taxonomy":"site"},"campaign21":{"name":"Campaign 21","type":"terms","id":"campaign21","slug":"campaign21","link":"/campaign21","taxonomy":"site"},"checkplease":{"name":"KQED food","grouping":["food","bayareabites","checkplease"],"parent":"food","type":"terms","id":"checkplease","slug":"checkplease","link":"/food","taxonomy":"site"},"education":{"name":"Education","grouping":["education"],"type":"terms","id":"education","slug":"education","link":"/education","taxonomy":"site"},"elections":{"name":"Elections","type":"terms","id":"elections","slug":"elections","link":"/elections","taxonomy":"site"},"events":{"name":"Events","type":"terms","id":"events","slug":"events","link":"/events","taxonomy":"site"},"event":{"name":"Event","alias":"events","type":"terms","id":"event","slug":"event","link":"/event","taxonomy":"site"},"filmschoolshorts":{"name":"Film School Shorts","type":"terms","id":"filmschoolshorts","slug":"filmschoolshorts","link":"/filmschoolshorts","taxonomy":"site"},"food":{"name":"KQED food","grouping":["food","bayareabites","checkplease"],"type":"terms","id":"food","slug":"food","link":"/food","taxonomy":"site"},"forum":{"name":"Forum","relatedContentQuery":"posts/forum?","parent":"news","type":"terms","id":"forum","slug":"forum","link":"/forum","taxonomy":"site"},"futureofyou":{"name":"Future of You","grouping":["science","futureofyou"],"parent":"science","type":"terms","id":"futureofyou","slug":"futureofyou","link":"/futureofyou","taxonomy":"site"},"jpepinheart":{"name":"KQED food","relatedContentQuery":"trending/food,bayareabites,checkplease","parent":"food","type":"terms","id":"jpepinheart","slug":"jpepinheart","link":"/food","taxonomy":"site"},"liveblog":{"name":"Live Blog","type":"terms","id":"liveblog","slug":"liveblog","link":"/liveblog","taxonomy":"site"},"livetv":{"name":"Live TV","parent":"tv","type":"terms","id":"livetv","slug":"livetv","link":"/livetv","taxonomy":"site"},"lowdown":{"name":"The Lowdown","relatedContentQuery":"posts/lowdown?","parent":"news","type":"terms","id":"lowdown","slug":"lowdown","link":"/lowdown","taxonomy":"site"},"mindshift":{"name":"Mindshift","parent":"news","description":"MindShift explores the future of education by highlighting the innovative – and sometimes counterintuitive – ways educators and parents are helping all children succeed.","type":"terms","id":"mindshift","slug":"mindshift","link":"/mindshift","taxonomy":"site"},"news":{"name":"News","grouping":["news","forum"],"type":"terms","id":"news","slug":"news","link":"/news","taxonomy":"site"},"perspectives":{"name":"Perspectives","parent":"radio","type":"terms","id":"perspectives","slug":"perspectives","link":"/perspectives","taxonomy":"site"},"podcasts":{"name":"Podcasts","type":"terms","id":"podcasts","slug":"podcasts","link":"/podcasts","taxonomy":"site"},"pop":{"name":"Pop","parent":"arts","type":"terms","id":"pop","slug":"pop","link":"/pop","taxonomy":"site"},"pressroom":{"name":"Pressroom","type":"terms","id":"pressroom","slug":"pressroom","link":"/pressroom","taxonomy":"site"},"quest":{"name":"Quest","parent":"science","type":"terms","id":"quest","slug":"quest","link":"/quest","taxonomy":"site"},"radio":{"name":"Radio","grouping":["forum","perspectives"],"description":"Listen to KQED Public Radio – home of Forum and The California Report – on 88.5 FM in San Francisco, 89.3 FM in Sacramento, 88.3 FM in Santa Rosa and 88.1 FM in Martinez.","type":"terms","id":"radio","slug":"radio","link":"/radio","taxonomy":"site"},"root":{"name":"KQED","image":"https://ww2.kqed.org/app/uploads/2020/02/KQED-OG-Image@1x.png","imageWidth":1200,"imageHeight":630,"headData":{"title":"KQED | News, Radio, Podcasts, TV | Public Media for Northern California","description":"KQED provides public radio, television, and independent reporting on issues that matter to the Bay Area. We’re the NPR and PBS member station for Northern California."},"type":"terms","id":"root","slug":"root","link":"/root","taxonomy":"site"},"science":{"name":"Science","grouping":["science","futureofyou"],"description":"KQED Science brings you award-winning science and environment coverage from the Bay Area and beyond.","type":"terms","id":"science","slug":"science","link":"/science","taxonomy":"site"},"stateofhealth":{"name":"State of Health","parent":"science","type":"terms","id":"stateofhealth","slug":"stateofhealth","link":"/stateofhealth","taxonomy":"site"},"support":{"name":"Support","type":"terms","id":"support","slug":"support","link":"/support","taxonomy":"site"},"thedolist":{"name":"The Do List","parent":"arts","type":"terms","id":"thedolist","slug":"thedolist","link":"/thedolist","taxonomy":"site"},"trulyca":{"name":"Truly CA","grouping":["arts","pop","trulyca"],"parent":"arts","type":"terms","id":"trulyca","slug":"trulyca","link":"/trulyca","taxonomy":"site"},"tv":{"name":"TV","type":"terms","id":"tv","slug":"tv","link":"/tv","taxonomy":"site"},"voterguide":{"name":"Voter Guide","parent":"elections","alias":"elections","type":"terms","id":"voterguide","slug":"voterguide","link":"/voterguide","taxonomy":"site"},"news_6944":{"type":"terms","id":"news_6944","meta":{"index":"terms_1591234321","site":"news","id":"6944","found":true},"relationships":{},"included":{},"name":"News Fix","slug":"news-fix","taxonomy":"program","description":null,"featImg":"https://ww2.kqed.org/app/uploads/sites/10/2014/10/News-Fix-Logo-Web-Banners-04.png","headData":{"title":"News Fix - Daily Dose of Bay Area News | KQED","description":"The News Fix is a daily news podcast from KQED that breaks down the latest headlines and provides in-depth analysis of the stories that matter to the Bay Area.","ogTitle":null,"ogDescription":null,"ogImgId":null,"twTitle":null,"twDescription":null,"twImgId":null,"imageData":{"ogImageSize":{"file":"https://cdn.kqed.org/wp-content/uploads/2020/02/KQED-OG-Image@1x.png","width":1200,"height":630},"twImageSize":{"file":"https://cdn.kqed.org/wp-content/uploads/2020/02/KQED-OG-Image@1x.png"},"twitterCard":"summary_large_image"}},"ttid":6968,"isLoading":false,"link":"/news/program/news-fix"},"source_news_11644927":{"type":"terms","id":"source_news_11644927","meta":{"override":true},"name":"Bay Curious","isLoading":false},"source_news_10779164":{"type":"terms","id":"source_news_10779164","meta":{"override":true},"name":"Bay Curious","link":"https://www.kqed.org/podcasts/baycurious","isLoading":false},"source_news_11827388":{"type":"terms","id":"source_news_11827388","meta":{"override":true},"name":"News","link":"http://kqed.org/","isLoading":false},"source_news_11818524":{"type":"terms","id":"source_news_11818524","meta":{"override":true},"name":"Coronavirus","link":"https://www.kqed.org/coronavirus","isLoading":false},"news_33523":{"type":"terms","id":"news_33523","meta":{"index":"terms_1591234321","site":"news","id":"33523","found":true},"relationships":{},"included":{},"name":"Bay Curious","slug":"bay-curious","taxonomy":"program","description":null,"featImg":null,"headData":{"title":"Bay Curious Archives | KQED News","description":null,"ogTitle":null,"ogDescription":null,"ogImgId":null,"twTitle":null,"twDescription":null,"twImgId":null},"ttid":33540,"isLoading":false,"link":"/news/program/bay-curious"},"news_17986":{"type":"terms","id":"news_17986","meta":{"index":"terms_1591234321","site":"news","id":"17986","found":true},"relationships":{},"included":{},"name":"Bay Curious","slug":"baycurious","taxonomy":"series","description":"\u003ch2>A podcast exploring the Bay Area one question at a time\u003c/h2>\r\n\r\n\u003caside>\r\n\u003cdiv style=\"width: 100%; padding-right: 20px;\">\r\n\r\nKQED’s \u003cstrong>Bay Curious\u003c/strong> gets to the bottom of the mysteries — both profound and peculiar — that give the Bay Area its unique identity. And we’ll do it with your help! You ask the questions. You decide what Bay Curious investigates. And you join us on the journey to find the answers.\r\n\u003cbr />\r\n\u003cspan class=\"alignleft\">\u003ca href=\"https://itunes.apple.com/us/podcast/id1172473406\">\u003cimg width=\"75px\" src=\"https://ww2.kqed.org/news/wp-content/uploads/sites/10/2016/11/DownloadOniTunes_100x100.png\">\u003c/a> \u003ca href=\"https://goo.gl/app/playmusic?ibi=com.google.PlayMusic&isi=691797987&ius=googleplaymusic&link=https://play.google.com/music/m/Ipi2mc5aqfen4nr2daayiziiyuy?t%3DBay_Curious\">\u003cimg width=\"75px\" src=\"https://ww2.kqed.org/news/wp-content/uploads/sites/10/2016/11/Google_Play_100x100.png\">\u003c/a>\u003c/span>\u003c/div>\r\n\u003c/aside> \r\n\u003ch2>What's your question?\u003c/h2>\r\n\u003cdiv id=\"huxq6\" class=\"curiosity-module\" data-pym-src=\"//modules.wearehearken.com/kqed/curiosity_modules/133\">\u003c/div>\r\n\u003cscript src=\"//assets.wearehearken.com/production/thirdparty/p.m.js\">\u003c/script>\r\n\u003ch2>Bay Curious monthly newsletter\u003c/h2>\r\nWe're launching it soon! \u003ca href=\"https://docs.google.com/forms/d/e/1FAIpQLSdEtzbyNbSQkRHCCAkKhoGiAl3Bd0zWxhk0ZseJ1KH_o_ZDjQ/viewform\" target=\"_blank\">Sign up\u003c/a> so you don't miss it when it drops.\r\n","featImg":"https://ww2.kqed.org/app/uploads/sites/10/2016/11/BayCuriousLogoFinal01-e1493662037229.png","headData":{"title":"Bay Curious Archives | KQED News","description":"A podcast exploring the Bay Area one question at a time KQED’s Bay Curious gets to the bottom of the mysteries — both profound and peculiar — that give the Bay Area its unique identity. And we’ll do it with your help! You ask the questions. You decide what Bay Curious investigates. And you join us on the journey to find the answers. What's your question? Bay Curious monthly newsletter We're launching it soon! Sign up so you don't miss it when it drops.","ogTitle":null,"ogDescription":null,"ogImgId":null,"twTitle":null,"twDescription":null,"twImgId":null},"ttid":18020,"isLoading":false,"link":"/news/series/baycurious"},"news_19906":{"type":"terms","id":"news_19906","meta":{"index":"terms_1591234321","site":"news","id":"19906","found":true},"relationships":{},"included":{},"name":"Environment","slug":"environment","taxonomy":"category","description":null,"featImg":null,"headData":{"title":"Environment Archives | KQED News","description":null,"ogTitle":null,"ogDescription":null,"ogImgId":null,"twTitle":null,"twDescription":null,"twImgId":null},"ttid":19923,"isLoading":false,"link":"/news/category/environment"},"news_33520":{"type":"terms","id":"news_33520","meta":{"index":"terms_1591234321","site":"news","id":"33520","found":true},"relationships":{},"included":{},"name":"Podcast","slug":"podcast","taxonomy":"category","description":null,"featImg":null,"headData":{"title":"Podcast Archives | KQED News","description":null,"ogTitle":null,"ogDescription":null,"ogImgId":null,"twTitle":null,"twDescription":null,"twImgId":null},"ttid":33537,"isLoading":false,"link":"/news/category/podcast"},"news_356":{"type":"terms","id":"news_356","meta":{"index":"terms_1591234321","site":"news","id":"356","found":true},"relationships":{},"included":{},"name":"Science","slug":"science","taxonomy":"category","description":null,"featImg":null,"headData":{"title":"Science Archives | KQED News","description":null,"ogTitle":null,"ogDescription":null,"ogImgId":null,"twTitle":null,"twDescription":null,"twImgId":null},"ttid":364,"isLoading":false,"link":"/news/category/science"},"news_20023":{"type":"terms","id":"news_20023","meta":{"index":"terms_1591234321","site":"news","id":"20023","found":true},"relationships":{},"included":{},"name":"environment","slug":"environment","taxonomy":"tag","description":null,"featImg":null,"headData":{"title":"environment Archives | KQED News","description":null,"ogTitle":null,"ogDescription":null,"ogImgId":null,"twTitle":null,"twDescription":null,"twImgId":null},"ttid":20040,"isLoading":false,"link":"/news/tag/environment"},"news_8":{"type":"terms","id":"news_8","meta":{"index":"terms_1591234321","site":"news","id":"8","found":true},"relationships":{},"included":{},"name":"News","slug":"news","taxonomy":"category","description":null,"featImg":null,"headData":{"title":"News Archives | KQED News","description":null,"ogTitle":null,"ogDescription":null,"ogImgId":null,"twTitle":null,"twDescription":null,"twImgId":null},"ttid":8,"isLoading":false,"link":"/news/category/news"},"news_18426":{"type":"terms","id":"news_18426","meta":{"index":"terms_1591234321","site":"news","id":"18426","found":true},"relationships":{},"included":{},"name":"Bay Curious","slug":"bay-curious","taxonomy":"tag","description":null,"featImg":null,"headData":{"title":"Bay Curious Archives | KQED News","description":null,"ogTitle":null,"ogDescription":null,"ogImgId":null,"twTitle":null,"twDescription":null,"twImgId":null},"ttid":18460,"isLoading":false,"link":"/news/tag/bay-curious"},"news_3070":{"type":"terms","id":"news_3070","meta":{"index":"terms_1591234321","site":"news","id":"3070","found":true},"relationships":{},"included":{},"name":"Colma","slug":"colma","taxonomy":"tag","description":null,"featImg":null,"headData":{"title":"Colma Archives | KQED News","description":null,"ogTitle":null,"ogDescription":null,"ogImgId":null,"twTitle":null,"twDescription":null,"twImgId":null},"ttid":3088,"isLoading":false,"link":"/news/tag/colma"},"news_72":{"type":"terms","id":"news_72","meta":{"index":"terms_1591234321","site":"news","id":"72","found":true},"relationships":{},"included":{},"name":"The California Report","slug":"the-california-report","taxonomy":"program","description":null,"featImg":"https://ww2.kqed.org/app/uploads/sites/10/2014/10/TCR-2-Logo-Web-Banners-03.png","headData":{"title":"The California Report Archives | KQED News","description":null,"ogTitle":null,"ogDescription":null,"ogImgId":null,"twTitle":null,"twDescription":null,"twImgId":null},"ttid":6969,"isLoading":false,"link":"/news/program/the-california-report"},"news_1169":{"type":"terms","id":"news_1169","meta":{"index":"terms_1591234321","site":"news","id":"1169","found":true},"relationships":{},"included":{},"name":"Immigration","slug":"immigration","taxonomy":"category","description":null,"featImg":null,"headData":{"title":"Immigration Archives | KQED News","description":null,"ogTitle":null,"ogDescription":null,"ogImgId":null,"twTitle":null,"twDescription":null,"twImgId":null},"ttid":1180,"isLoading":false,"link":"/news/category/immigration"},"news_27540":{"type":"terms","id":"news_27540","meta":{"index":"terms_1591234321","site":"news","id":"27540","found":true},"relationships":{},"included":{},"name":"2020 election","slug":"2020-election","taxonomy":"tag","description":null,"featImg":null,"headData":{"title":"2020 election Archives | KQED News","description":null,"ogTitle":null,"ogDescription":null,"ogImgId":null,"twTitle":null,"twDescription":null,"twImgId":null},"ttid":27557,"isLoading":false,"link":"/news/tag/2020-election"},"news_27370":{"type":"terms","id":"news_27370","meta":{"index":"terms_1591234321","site":"news","id":"27370","found":true},"relationships":{},"included":{},"name":"Election 2020","slug":"election2020","taxonomy":"tag","description":null,"featImg":null,"headData":{"title":"Election 2020 Archives | KQED News","description":null,"ogTitle":null,"ogDescription":null,"ogImgId":null,"twTitle":null,"twDescription":null,"twImgId":null},"ttid":27387,"isLoading":false,"link":"/news/tag/election2020"},"news_20611":{"type":"terms","id":"news_20611","meta":{"index":"terms_1591234321","site":"news","id":"20611","found":true},"relationships":{},"included":{},"name":"immigrant","slug":"immigrant","taxonomy":"tag","description":null,"featImg":null,"headData":{"title":"immigrant Archives | KQED News","description":null,"ogTitle":null,"ogDescription":null,"ogImgId":null,"twTitle":null,"twDescription":null,"twImgId":null},"ttid":20628,"isLoading":false,"link":"/news/tag/immigrant"},"news_20202":{"type":"terms","id":"news_20202","meta":{"index":"terms_1591234321","site":"news","id":"20202","found":true},"relationships":{},"included":{},"name":"immigration","slug":"immigration","taxonomy":"tag","description":null,"featImg":null,"headData":{"title":"immigration Archives | KQED News","description":null,"ogTitle":null,"ogDescription":null,"ogImgId":null,"twTitle":null,"twDescription":null,"twImgId":null},"ttid":20219,"isLoading":false,"link":"/news/tag/immigration"},"news_2027":{"type":"terms","id":"news_2027","meta":{"index":"terms_1591234321","site":"news","id":"2027","found":true},"relationships":{},"included":{},"name":"voting","slug":"voting","taxonomy":"tag","description":null,"featImg":null,"headData":{"title":"voting Archives | KQED News","description":null,"ogTitle":null,"ogDescription":null,"ogImgId":null,"twTitle":null,"twDescription":null,"twImgId":null},"ttid":2042,"isLoading":false,"link":"/news/tag/voting"},"news_19101":{"type":"terms","id":"news_19101","meta":{"index":"terms_1591234321","site":"news","id":"19101","found":true},"relationships":{},"included":{},"name":"Election 2016","slug":"election-2016","taxonomy":"series","description":null,"featImg":"https://ww2.kqed.org/app/uploads/sites/10/2016/04/election2016_hor.png","headData":{"title":"Election 2016 Archives | KQED News","description":null,"ogTitle":null,"ogDescription":null,"ogImgId":null,"twTitle":null,"twDescription":null,"twImgId":null},"ttid":19118,"isLoading":false,"link":"/news/series/election-2016"},"news_6188":{"type":"terms","id":"news_6188","meta":{"index":"terms_1591234321","site":"news","id":"6188","found":true},"relationships":{},"included":{},"name":"Law and Justice","slug":"law-and-justice","taxonomy":"category","description":null,"featImg":null,"headData":{"title":"Law and Justice Archives | KQED News","description":null,"ogTitle":null,"ogDescription":null,"ogImgId":null,"twTitle":null,"twDescription":null,"twImgId":null},"ttid":6212,"isLoading":false,"link":"/news/category/law-and-justice"},"news_13":{"type":"terms","id":"news_13","meta":{"index":"terms_1591234321","site":"news","id":"13","found":true},"relationships":{},"included":{},"name":"Politics and Government","slug":"politics-and-government","taxonomy":"category","description":null,"featImg":null,"headData":{"title":"Politics and Government Archives | KQED News","description":null,"ogTitle":null,"ogDescription":null,"ogImgId":null,"twTitle":null,"twDescription":null,"twImgId":null},"ttid":13,"isLoading":false,"link":"/news/category/politics-and-government"},"news_1323":{"type":"terms","id":"news_1323","meta":{"index":"terms_1591234321","site":"news","id":"1323","found":true},"relationships":{},"included":{},"name":"Donald Trump","slug":"donald-trump","taxonomy":"tag","description":null,"featImg":null,"headData":{"title":"Donald Trump Archives | KQED News","description":null,"ogTitle":null,"ogDescription":null,"ogImgId":null,"twTitle":null,"twDescription":null,"twImgId":null},"ttid":1335,"isLoading":false,"link":"/news/tag/donald-trump"},"news_20302":{"type":"terms","id":"news_20302","meta":{"index":"terms_1591234321","site":"news","id":"20302","found":true},"relationships":{},"included":{},"name":"electoral college","slug":"electoral-college","taxonomy":"tag","description":null,"featImg":null,"headData":{"title":"electoral college Archives | KQED News","description":null,"ogTitle":null,"ogDescription":null,"ogImgId":null,"twTitle":null,"twDescription":null,"twImgId":null},"ttid":20319,"isLoading":false,"link":"/news/tag/electoral-college"},"news_717":{"type":"terms","id":"news_717","meta":{"index":"terms_1591234321","site":"news","id":"717","found":true},"relationships":{},"included":{},"name":"Joe Biden","slug":"joe-biden","taxonomy":"tag","description":null,"featImg":null,"headData":{"title":"Joe Biden Archives | KQED News","description":null,"ogTitle":null,"ogDescription":null,"ogImgId":null,"twTitle":null,"twDescription":null,"twImgId":null},"ttid":726,"isLoading":false,"link":"/news/tag/joe-biden"},"news_17286":{"type":"terms","id":"news_17286","meta":{"index":"terms_1591234321","site":"news","id":"17286","found":true},"relationships":{},"included":{},"name":"tcr","slug":"tcr","taxonomy":"tag","description":null,"featImg":null,"headData":{"title":"tcr Archives | KQED News","description":null,"ogTitle":null,"ogDescription":null,"ogImgId":null,"twTitle":null,"twDescription":null,"twImgId":null},"ttid":17318,"isLoading":false,"link":"/news/tag/tcr"},"news_1758":{"type":"terms","id":"news_1758","meta":{"index":"terms_1591234321","site":"news","id":"1758","found":true},"relationships":{},"included":{},"name":"Economy","slug":"economy","taxonomy":"category","description":null,"featImg":null,"headData":{"title":"Economy Archives | KQED News","description":"Full coverage of the economy","ogTitle":null,"ogDescription":null,"ogImgId":null,"twTitle":null,"twDescription":null,"twImgId":null},"ttid":2648,"isLoading":false,"link":"/news/category/economy"},"news_6266":{"type":"terms","id":"news_6266","meta":{"index":"terms_1591234321","site":"news","id":"6266","found":true},"relationships":{},"included":{},"name":"Housing","slug":"housing","taxonomy":"category","description":null,"featImg":null,"headData":{"title":"Housing Archives | KQED News","description":null,"ogTitle":null,"ogDescription":null,"ogImgId":null,"twTitle":null,"twDescription":null,"twImgId":null},"ttid":6290,"isLoading":false,"link":"/news/category/housing"},"news_24805":{"type":"terms","id":"news_24805","meta":{"index":"terms_1591234321","site":"news","id":"24805","found":true},"relationships":{},"included":{},"name":"affordable housing crisis","slug":"affordable-housing-crisis","taxonomy":"tag","description":null,"featImg":null,"headData":{"title":"affordable housing crisis Archives | KQED News","description":null,"ogTitle":null,"ogDescription":null,"ogImgId":null,"twTitle":null,"twDescription":null,"twImgId":null},"ttid":24822,"isLoading":false,"link":"/news/tag/affordable-housing-crisis"},"news_27350":{"type":"terms","id":"news_27350","meta":{"index":"terms_1591234321","site":"news","id":"27350","found":true},"relationships":{},"included":{},"name":"coronavirus","slug":"coronavirus","taxonomy":"tag","description":null,"featImg":null,"headData":{"title":"coronavirus Archives | KQED News","description":null,"ogTitle":null,"ogDescription":null,"ogImgId":null,"twTitle":null,"twDescription":null,"twImgId":null},"ttid":27367,"isLoading":false,"link":"/news/tag/coronavirus"},"news_27504":{"type":"terms","id":"news_27504","meta":{"index":"terms_1591234321","site":"news","id":"27504","found":true},"relationships":{},"included":{},"name":"covid-19","slug":"covid-19","taxonomy":"tag","description":null,"featImg":null,"headData":{"title":"covid-19 Archives | KQED News","description":null,"ogTitle":null,"ogDescription":null,"ogImgId":null,"twTitle":null,"twDescription":null,"twImgId":null},"ttid":27521,"isLoading":false,"link":"/news/tag/covid-19"},"news_21883":{"type":"terms","id":"news_21883","meta":{"index":"terms_1591234321","site":"news","id":"21883","found":true},"relationships":{},"included":{},"name":"eviction","slug":"eviction","taxonomy":"tag","description":null,"featImg":null,"headData":{"title":"eviction Archives | KQED News","description":null,"ogTitle":null,"ogDescription":null,"ogImgId":null,"twTitle":null,"twDescription":null,"twImgId":null},"ttid":21900,"isLoading":false,"link":"/news/tag/eviction"},"news_27701":{"type":"terms","id":"news_27701","meta":{"index":"terms_1591234321","site":"news","id":"27701","found":true},"relationships":{},"included":{},"name":"eviction moratorium","slug":"eviction-moratorium","taxonomy":"tag","description":null,"featImg":null,"headData":{"title":"eviction moratorium Archives | KQED News","description":null,"ogTitle":null,"ogDescription":null,"ogImgId":null,"twTitle":null,"twDescription":null,"twImgId":null},"ttid":27718,"isLoading":false,"link":"/news/tag/eviction-moratorium"},"news_27626":{"type":"terms","id":"news_27626","meta":{"index":"terms_1591234321","site":"news","id":"27626","found":true},"relationships":{},"included":{},"name":"featured-news","slug":"featured-news","taxonomy":"tag","description":null,"featImg":null,"headData":{"title":"featured-news Archives | KQED News","description":null,"ogTitle":null,"ogDescription":null,"ogImgId":null,"twTitle":null,"twDescription":null,"twImgId":null},"ttid":27643,"isLoading":false,"link":"/news/tag/featured-news"},"news_85":{"type":"terms","id":"news_85","meta":{"index":"terms_1591234321","site":"news","id":"85","found":true},"relationships":{},"included":{},"name":"Fruitvale","slug":"fruitvale","taxonomy":"tag","description":null,"featImg":null,"headData":{"title":"Fruitvale Archives | KQED News","description":null,"ogTitle":null,"ogDescription":null,"ogImgId":null,"twTitle":null,"twDescription":null,"twImgId":null},"ttid":87,"isLoading":false,"link":"/news/tag/fruitvale"},"news_1775":{"type":"terms","id":"news_1775","meta":{"index":"terms_1591234321","site":"news","id":"1775","found":true},"relationships":{},"included":{},"name":"housing","slug":"housing","taxonomy":"tag","description":null,"featImg":null,"headData":{"title":"housing Archives | KQED News","description":null,"ogTitle":null,"ogDescription":null,"ogImgId":null,"twTitle":null,"twDescription":null,"twImgId":null},"ttid":1790,"isLoading":false,"link":"/news/tag/housing"},"news_27208":{"type":"terms","id":"news_27208","meta":{"index":"terms_1591234321","site":"news","id":"27208","found":true},"relationships":{},"included":{},"name":"housing affordability","slug":"housing-affordability","taxonomy":"tag","description":null,"featImg":null,"headData":{"title":"housing affordability Archives | KQED News","description":null,"ogTitle":null,"ogDescription":null,"ogImgId":null,"twTitle":null,"twDescription":null,"twImgId":null},"ttid":27225,"isLoading":false,"link":"/news/tag/housing-affordability"},"news_21358":{"type":"terms","id":"news_21358","meta":{"index":"terms_1591234321","site":"news","id":"21358","found":true},"relationships":{},"included":{},"name":"housing crisis","slug":"housing-crisis","taxonomy":"tag","description":null,"featImg":null,"headData":{"title":"housing crisis Archives | KQED News","description":null,"ogTitle":null,"ogDescription":null,"ogImgId":null,"twTitle":null,"twDescription":null,"twImgId":null},"ttid":21375,"isLoading":false,"link":"/news/tag/housing-crisis"},"news_20265":{"type":"terms","id":"news_20265","meta":{"index":"terms_1591234321","site":"news","id":"20265","found":true},"relationships":{},"included":{},"name":"housing insecurity","slug":"housing-insecurity","taxonomy":"tag","description":null,"featImg":null,"headData":{"title":"housing insecurity Archives | KQED News","description":null,"ogTitle":null,"ogDescription":null,"ogImgId":null,"twTitle":null,"twDescription":null,"twImgId":null},"ttid":20282,"isLoading":false,"link":"/news/tag/housing-insecurity"},"news_17708":{"type":"terms","id":"news_17708","meta":{"index":"terms_1591234321","site":"news","id":"17708","found":true},"relationships":{},"included":{},"name":"immigrants","slug":"immigrants","taxonomy":"tag","description":null,"featImg":null,"headData":{"title":"immigrants Archives | KQED News","description":null,"ogTitle":null,"ogDescription":null,"ogImgId":null,"twTitle":null,"twDescription":null,"twImgId":null},"ttid":17742,"isLoading":false,"link":"/news/tag/immigrants"},"news_18":{"type":"terms","id":"news_18","meta":{"index":"terms_1591234321","site":"news","id":"18","found":true},"relationships":{},"included":{},"name":"Oakland","slug":"oakland","taxonomy":"tag","description":null,"featImg":null,"headData":{"title":"Oakland Archives | KQED News","description":null,"ogTitle":null,"ogDescription":null,"ogImgId":null,"twTitle":null,"twDescription":null,"twImgId":null},"ttid":86,"isLoading":false,"link":"/news/tag/oakland"},"news_27707":{"type":"terms","id":"news_27707","meta":{"index":"terms_1591234321","site":"news","id":"27707","found":true},"relationships":{},"included":{},"name":"tenants","slug":"tenants","taxonomy":"tag","description":null,"featImg":null,"headData":{"title":"tenants Archives | KQED News","description":null,"ogTitle":null,"ogDescription":null,"ogImgId":null,"twTitle":null,"twDescription":null,"twImgId":null},"ttid":27724,"isLoading":false,"link":"/news/tag/tenants"},"news_3733":{"type":"terms","id":"news_3733","meta":{"index":"terms_1591234321","site":"news","id":"3733","found":true},"relationships":{},"included":{},"name":"wages","slug":"wages","taxonomy":"tag","description":null,"featImg":null,"headData":{"title":"wages Archives | KQED News","description":null,"ogTitle":null,"ogDescription":null,"ogImgId":null,"twTitle":null,"twDescription":null,"twImgId":null},"ttid":3751,"isLoading":false,"link":"/news/tag/wages"},"news_3149":{"type":"terms","id":"news_3149","meta":{"index":"terms_1591234321","site":"news","id":"3149","found":true},"relationships":{},"included":{},"name":"California State Prison","slug":"california-state-prison","taxonomy":"tag","description":null,"featImg":null,"headData":{"title":"California State Prison Archives | KQED News","description":null,"ogTitle":null,"ogDescription":null,"ogImgId":null,"twTitle":null,"twDescription":null,"twImgId":null},"ttid":3167,"isLoading":false,"link":"/news/tag/california-state-prison"},"news_1629":{"type":"terms","id":"news_1629","meta":{"index":"terms_1591234321","site":"news","id":"1629","found":true},"relationships":{},"included":{},"name":"CDCR","slug":"cdcr","taxonomy":"tag","description":null,"featImg":null,"headData":{"title":"CDCR Archives | KQED News","description":null,"ogTitle":null,"ogDescription":null,"ogImgId":null,"twTitle":null,"twDescription":null,"twImgId":null},"ttid":1641,"isLoading":false,"link":"/news/tag/cdcr"},"news_21027":{"type":"terms","id":"news_21027","meta":{"index":"terms_1591234321","site":"news","id":"21027","found":true},"relationships":{},"included":{},"name":"ICE","slug":"ice","taxonomy":"tag","description":null,"featImg":null,"headData":{"title":"ICE Archives | KQED News","description":null,"ogTitle":null,"ogDescription":null,"ogImgId":null,"twTitle":null,"twDescription":null,"twImgId":null},"ttid":21044,"isLoading":false,"link":"/news/tag/ice"},"news_23454":{"type":"terms","id":"news_23454","meta":{"index":"terms_1591234321","site":"news","id":"23454","found":true},"relationships":{},"included":{},"name":"Immigration and Customs Enforcement","slug":"immigration-and-customs-enforcement","taxonomy":"tag","description":null,"featImg":null,"headData":{"title":"Immigration and Customs Enforcement Archives | KQED News","description":null,"ogTitle":null,"ogDescription":null,"ogImgId":null,"twTitle":null,"twDescription":null,"twImgId":null},"ttid":23471,"isLoading":false,"link":"/news/tag/immigration-and-customs-enforcement"},"news_20463":{"type":"terms","id":"news_20463","meta":{"index":"terms_1591234321","site":"news","id":"20463","found":true},"relationships":{},"included":{},"name":"refugee","slug":"refugee","taxonomy":"tag","description":null,"featImg":null,"headData":{"title":"refugee Archives | KQED News","description":null,"ogTitle":null,"ogDescription":null,"ogImgId":null,"twTitle":null,"twDescription":null,"twImgId":null},"ttid":20480,"isLoading":false,"link":"/news/tag/refugee"},"news_23":{"type":"terms","id":"news_23","meta":{"index":"terms_1591234321","site":"news","id":"23","found":true},"relationships":{},"included":{},"name":"San Quentin State Prison","slug":"san-quentin-state-prison","taxonomy":"tag","description":null,"featImg":null,"headData":{"title":"San Quentin State Prison Archives | KQED News","description":null,"ogTitle":null,"ogDescription":null,"ogImgId":null,"twTitle":null,"twDescription":null,"twImgId":null},"ttid":23,"isLoading":false,"link":"/news/tag/san-quentin-state-prison"},"news_457":{"type":"terms","id":"news_457","meta":{"index":"terms_1591234321","site":"news","id":"457","found":true},"relationships":{},"included":{},"name":"Health","slug":"health","taxonomy":"category","description":null,"featImg":null,"headData":{"title":"Health Archives | KQED News","description":null,"ogTitle":null,"ogDescription":null,"ogImgId":null,"twTitle":null,"twDescription":null,"twImgId":null},"ttid":16998,"isLoading":false,"link":"/news/category/health"},"news_1759":{"type":"terms","id":"news_1759","meta":{"index":"terms_1591234321","site":"news","id":"1759","found":true},"relationships":{},"included":{},"name":"budget","slug":"budget","taxonomy":"tag","description":null,"featImg":null,"headData":{"title":"budget Archives | KQED News","description":null,"ogTitle":null,"ogDescription":null,"ogImgId":null,"twTitle":null,"twDescription":null,"twImgId":null},"ttid":1772,"isLoading":false,"link":"/news/tag/budget"},"news_18538":{"type":"terms","id":"news_18538","meta":{"index":"terms_1591234321","site":"news","id":"18538","found":true},"relationships":{},"included":{},"name":"California","slug":"california","taxonomy":"tag","description":null,"featImg":null,"headData":{"title":"California Archives | KQED News","description":null,"ogTitle":null,"ogDescription":null,"ogImgId":null,"twTitle":null,"twDescription":null,"twImgId":null},"ttid":31,"isLoading":false,"link":"/news/tag/california"},"news_16":{"type":"terms","id":"news_16","meta":{"index":"terms_1591234321","site":"news","id":"16","found":true},"relationships":{},"included":{},"name":"Gavin Newsom","slug":"gavin-newsom","taxonomy":"tag","description":null,"featImg":null,"headData":{"title":"Gavin Newsom Archives | KQED News","description":null,"ogTitle":null,"ogDescription":null,"ogImgId":null,"twTitle":null,"twDescription":null,"twImgId":null},"ttid":16,"isLoading":false,"link":"/news/tag/gavin-newsom"},"news_683":{"type":"terms","id":"news_683","meta":{"index":"terms_1591234321","site":"news","id":"683","found":true},"relationships":{},"included":{},"name":"health care","slug":"health-care","taxonomy":"tag","description":null,"featImg":null,"headData":{"title":"health care Archives | KQED News","description":null,"ogTitle":null,"ogDescription":null,"ogImgId":null,"twTitle":null,"twDescription":null,"twImgId":null},"ttid":692,"isLoading":false,"link":"/news/tag/health-care"},"news_2605":{"type":"terms","id":"news_2605","meta":{"index":"terms_1591234321","site":"news","id":"2605","found":true},"relationships":{},"included":{},"name":"Medi-Cal","slug":"medi-cal","taxonomy":"tag","description":null,"featImg":null,"headData":{"title":"Medi-Cal Archives | KQED News","description":null,"ogTitle":null,"ogDescription":null,"ogImgId":null,"twTitle":null,"twDescription":null,"twImgId":null},"ttid":2621,"isLoading":false,"link":"/news/tag/medi-cal"},"news_24162":{"type":"terms","id":"news_24162","meta":{"index":"terms_1591234321","site":"news","id":"24162","found":true},"relationships":{},"included":{},"name":"Chesa Boudin","slug":"chesa-boudin","taxonomy":"tag","description":null,"featImg":null,"headData":{"title":"Chesa Boudin Archives | KQED News","description":null,"ogTitle":null,"ogDescription":null,"ogImgId":null,"twTitle":null,"twDescription":null,"twImgId":null},"ttid":24179,"isLoading":false,"link":"/news/tag/chesa-boudin"},"news_38":{"type":"terms","id":"news_38","meta":{"index":"terms_1591234321","site":"news","id":"38","found":true},"relationships":{},"included":{},"name":"San Francisco","slug":"san-francisco","taxonomy":"tag","description":null,"featImg":null,"headData":{"title":"San Francisco Archives | KQED News","description":null,"ogTitle":null,"ogDescription":null,"ogImgId":null,"twTitle":null,"twDescription":null,"twImgId":null},"ttid":58,"isLoading":false,"link":"/news/tag/san-francisco"},"news_959":{"type":"terms","id":"news_959","meta":{"index":"terms_1591234321","site":"news","id":"959","found":true},"relationships":{},"included":{},"name":"San Francisco Public Defender","slug":"san-francisco-public-defender","taxonomy":"tag","description":null,"featImg":null,"headData":{"title":"San Francisco Public Defender Archives | KQED News","description":null,"ogTitle":null,"ogDescription":null,"ogImgId":null,"twTitle":null,"twDescription":null,"twImgId":null},"ttid":969,"isLoading":false,"link":"/news/tag/san-francisco-public-defender"},"news_18775":{"type":"terms","id":"news_18775","meta":{"index":"terms_1591234321","site":"news","id":"18775","found":true},"relationships":{},"included":{},"name":"sanctuary city","slug":"sanctuary-city","taxonomy":"tag","description":null,"featImg":null,"headData":{"title":"sanctuary city Archives | KQED News","description":null,"ogTitle":null,"ogDescription":null,"ogImgId":null,"twTitle":null,"twDescription":null,"twImgId":null},"ttid":18792,"isLoading":false,"link":"/news/tag/sanctuary-city"},"news_23067":{"type":"terms","id":"news_23067","meta":{"index":"terms_1591234321","site":"news","id":"23067","found":true},"relationships":{},"included":{},"name":"bullying","slug":"bullying","taxonomy":"tag","description":null,"featImg":null,"headData":{"title":"bullying Archives | KQED News","description":null,"ogTitle":null,"ogDescription":null,"ogImgId":null,"twTitle":null,"twDescription":null,"twImgId":null},"ttid":23084,"isLoading":false,"link":"/news/tag/bullying"},"news_26790":{"type":"terms","id":"news_26790","meta":{"index":"terms_1591234321","site":"news","id":"26790","found":true},"relationships":{},"included":{},"name":"Council on American-Islamic Relations","slug":"council-on-american-islamic-relations","taxonomy":"tag","description":null,"featImg":null,"headData":{"title":"Council on American-Islamic Relations Archives | KQED News","description":null,"ogTitle":null,"ogDescription":null,"ogImgId":null,"twTitle":null,"twDescription":null,"twImgId":null},"ttid":26807,"isLoading":false,"link":"/news/tag/council-on-american-islamic-relations"},"news_20601":{"type":"terms","id":"news_20601","meta":{"index":"terms_1591234321","site":"news","id":"20601","found":true},"relationships":{},"included":{},"name":"Muslim","slug":"muslim","taxonomy":"tag","description":null,"featImg":null,"headData":{"title":"Muslim Archives | KQED News","description":null,"ogTitle":null,"ogDescription":null,"ogImgId":null,"twTitle":null,"twDescription":null,"twImgId":null},"ttid":20618,"isLoading":false,"link":"/news/tag/muslim"},"news_2998":{"type":"terms","id":"news_2998","meta":{"index":"terms_1591234321","site":"news","id":"2998","found":true},"relationships":{},"included":{},"name":"schools","slug":"schools","taxonomy":"tag","description":null,"featImg":null,"headData":{"title":"schools Archives | KQED News","description":null,"ogTitle":null,"ogDescription":null,"ogImgId":null,"twTitle":null,"twDescription":null,"twImgId":null},"ttid":3016,"isLoading":false,"link":"/news/tag/schools"}},"userAgentReducer":{"userAgent":"Mozilla/5.0 AppleWebKit/537.36 (KHTML, like Gecko; compatible; ClaudeBot/1.0; +claudebot@anthropic.com)","isBot":true},"userPermissionsReducer":{"wpLoggedIn":false},"localStorageReducer":{},"browserHistoryReducer":[],"eventsReducer":{},"fssReducer":{},"tvDailyScheduleReducer":{},"tvWeeklyScheduleReducer":{},"tvPrimetimeScheduleReducer":{},"tvMonthlyScheduleReducer":{},"userAccountReducer":{"routeTo":"","showDeleteConfirmModal":false,"user":{"userId":"","isFound":false,"firstName":"","lastName":"","phoneNumber":"","email":"","articles":[]}},"youthMediaReducer":{},"checkPleaseReducer":{"filterData":{},"restaurantData":[]},"reframeReducer":{"attendee":null},"location":{"pathname":"/news/program/news-fix","previousPathname":"/"}}