Love KQED? Consider joining the CAPLove KQED? Consider joining the CAP
About the KQED Community Advisory Panel (CAP)
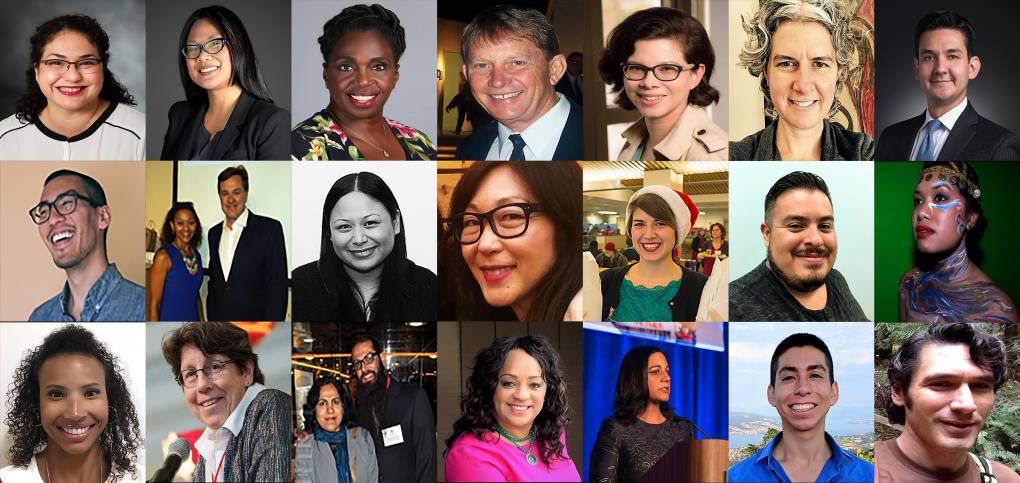
We are a group of community members that meets six times a year to support, give feedback, and engage KQED in community building. We represent a multitude of backgrounds and span a spectrum of professions, religions, sexual orientations, and racial and ethnic groups. We bring the entirety of ourselves to help inform and support KQED.
We are looking for leaders to join the CAP
Do you like to connect your communities to reliable locally produced information? KQED is for everyone who wants to be more. Our television, radio, digital media, and educational services change lives for the better and help individuals and communities achieve their full potential.
The CAP is an engaged group of educators, artists, finance, activists, non-profit, lawyers, business owners, and STEM professionals who value our communities, families, and neighbors. We bring all of ourselves to give our perspectives to the KQED community.
Frequently asked questions
Why does KQED have a Community Advisory Panel?
Federal law requires all public media organizations to have a group of community members that interact and give feedback to the organization. KQED has one of the most active and organized CAP’s in the country. They meet and engage with the staff and board in a coordinated way that allows for open communication.
How are folks chosen for the CAP?
The KQED CAP has bylaws that are in line with the federally mandate reason for its creation. The members along with KQED staff nominate community members who are known for their engagement and ties to different communities across the Bay Area. We define community in several different ways, geography, professions, religions, sexual orientations, and racial and ethnic groups as well as participation and leadership. The nominees are interviewed and voted upon by the CAP and accepted by the Board. They serve for two years upon which they might be renewed for a total of three terms or six years.
How often does the CAP meet?
The CAP meets five times a year with the subcommittees organizing their own meetings to fulfill the mission, community representation within KQED. The CAP meets with the KQED board once a year to give feedback and showcase our community involvement.
Hear from CAP members
"As a Bay Area native, I was honored to be nominated to join the Community Advisory Panel (CAP). I grew up watching KQED and now utilize every (high-quality fact-based) platform they offer on a daily basis. Getting a glimpse from the inside and seeing firsthand how genuinely committed KQED is to serve and represent a diverse community has only made my love and support growth. The CAP is filled with incredible people from all over the Bay and having the privilege of connecting with so many amazing folks is an extraordinary gift in itself. I feel deeply committed to our collective work to connect KQED directly to communities we’re part of to ensure all voices are heard."
- Christine Padilla, CAP Member
"KQED’s Community Advisory Panel (CAP) is an essential way to ensure that all our community voices are heard and represented. Serving on CAP provided me with important knowledge about how media organizations function and the challenges they face, but also allowed me and others to give KQED necessary feedback and input to make for more equitable coverage."
- Shadi Karra, former CAP Member and current KQED Board Member
Want to learn more? Get in touch
To learn more, reach out to Yo Ann Martinez:
ymartinez@kqed.org
(415) 553-2853